Placeholder

Customer Forum

Current Sales Pipeline by Stage

Workbooks Support Posted: 2016-03-21 17:07

Did you know about our Success Clinics?

This forum post is discussed in our Reports to Skyrocket your Sales Success Clinic video.

In the Blog post How to Skyrocket your Sales Team's Performance Using these 6 CRM reports - today! the focus was on reports to give real-time information to sales leaders in order for them to make informed business decisions regarding their team's performance. The information below describes how to create the second of those reports: Current Sales Pipeline by Stage: How is your pipeline looking for this quarter? Will sales reach target?

NOTE: You can either build a report from scratch using the steps in this forum post or you can use the template. To find a template choose an option to Create a report from a template report, rather than Create a new blank report. Then, use the filters to find a template called Current Sales Pipeline by Stage. The template uses a criterion to look at THIS financial year's records, whereas in this forum post we chose to restrict results to THIS quarter's records. Depending on the stages you have, you may wish to include/exclude sales that have been won or lost.

2. This Quarter's Pipeline Report

The Sales pipeline report below shows not only what is going on in different sales stages, but also how well Sales Reps are doing individually in those stages. It is clear where the majority of the total pipeline is sitting and which Sales Rep has the fewest Opportunities. Information on creating this kind of report is available in the screenshot below.

  • Start by creating a report on Opportunities. Here, we need to add only three columns on the Details tab: Assigned to name, Stage and Amount. If your records are in more than one currency, make sure to pick the Amount (home currency), so that the Opportunity value is automatically shown in its home currency equivalent (based on the exchange rates you've set up for that time period) regardless of the currency used in the Opportunity.

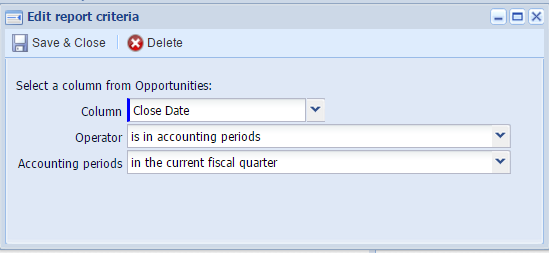
  • In order to have results for the specific period that you want to report in, you can add report criteria on your Details tab. Go to Details > Criteria > Add criteria and choose how you want your records to be restricted. In this report, we chose to limit records to this fiscal quarter as shown below.

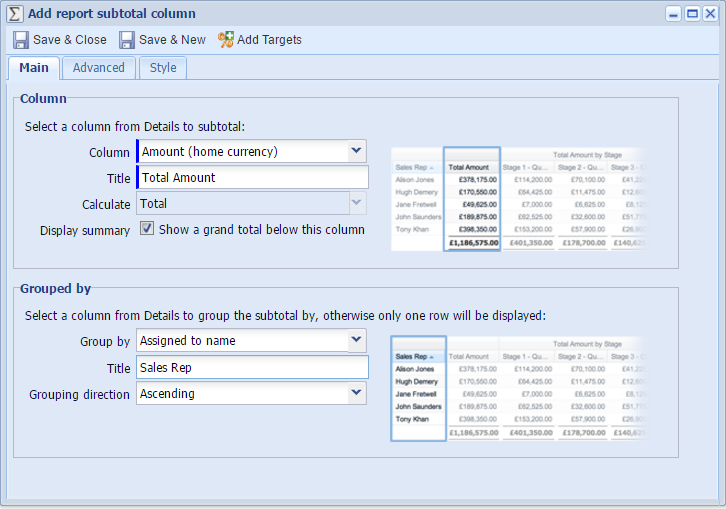
  • Add a Summary view based on your Details view. Now you want to be able to see what amount each Sales Rep has separately . Click Add value column > Subtotal column. In the field next to Column select Amount (home currency). Pick the appropriate name and write it in the Title field. Now you need to group Total Amount by Sales Rep. To do this, write in Assigned to name in the field next to Group by and pick the appropriate name again. In this report, we chose Total Amount and Sales Rep accordingly as shown below.

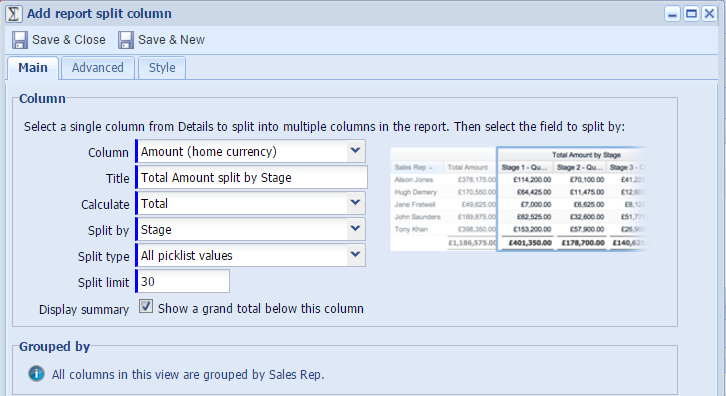
  • Now you want to add a Split column to show what amount each Sales Rep has at different stages. Click Add value column > Split column and choose Amount split by Stage. Again, you can choose the Title as you wish. The screenshot below shows how we've set this up:

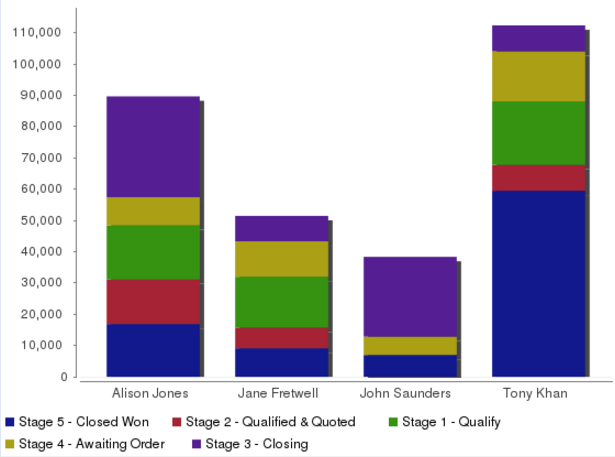
  • If you click Refresh preview, you'll be able to see the sales pipeline for the quarter, by Sales Rep, split by the Stage in the pipeline. If you wish, you can represent the report visually as a graph. You can do this by going to Summary and clicking Chart this view > Create a bar chart. This will produce a graph similar to the one shown below depending on your settings. It shows the size of each Sales Rep's pipeline and how it is distributed by Stage.

  • You've now got a report that allows you to quickly identify who has the healthiest pipelines and where the majority of the total pipeline is sitting. You can drill down on any one of the cells and see Opportunities which make up the pipeline and get yourself comfortable that they are going to close. This information helps you to lead your team in the right direction by making sure they move their open Opportunities through the sales cycle.