


Get a quick quote with our pricing calculator
Get a quick quote with our pricing calculator

Tracking the right KPIs can make the difference between success and failure. So what should you be tracking and what insight can it provide?Below are the 6 reports we recommend every sales leader to have:
Being able to report instantly on your sales numbers offers instant evidence of your company’s performance. Don’t rely on the finance department to give you the numbers after the month or quarter has closed, you need real-time information as it happens.
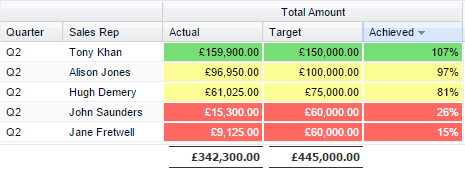
We can see at a glance that Tony has already hit his target and that Alison and Hugh aren’t too far behind. However John at 26% of target and Jane at 15% of target (in red) are a long way off. Do they need some help, are they getting enough leads, do they need some sales training? This report enables you to take corrective action early, before the quarter is complete.
Are we going to hit the number? How many times have you needed to answer that question. To answer it effectively you need to see what’s going on with your sales pipeline, broken down by sales rep and sales stage.
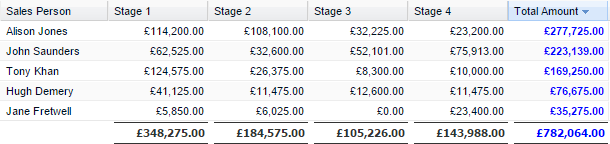
In this report, you can see the sales pipeline for the quarter, by salesperson, split by the stage. We know from Report 1, that we need another £102k of sales to hit target. The good news is we have £144k in Stage 4 and £105k in Stage 3 – so it looks promising.
At an individual level, whilst John was only at £15.3k (26% of target) you can see he has £52k at Stage 3 and £75k at Stage 4 so he may well still hit his target of £60k. Using Workbooks CRM, you can drill down on any one of the cells and see opportunities that make up the pipeline and get yourself comfortable they are going to close.
In contrast, Jane has no open opportunities at Stage 3 and only £23.4k at Stage 4 so even if she closes all of her Stage 4 pipeline she is still going to miss her numbers.
The majority of the total pipeline is sitting at Stage 1 (£348k). Maybe you can focus your team on moving their open opportunities through the sales cycle.
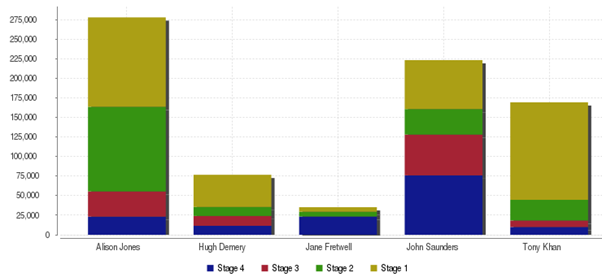
This same report can be represented visually as a graph, allowing you to quickly see the size of each of your reps pipeline and how it is distributed by stage.
Above you are able to quickly identify that Alison, John and Tony have the biggest pipelines, but you will also notice that the majority of Tony’s opportunities are sitting at Stage 1. Can he work on nurturing any of these through the sales cycle?
Want to build this report? Click here for step-by-step instructions. Or visit our Reporting forum.
Do you know who your best sales rep is? You may have thought that Tony was your best sales rep as he has closed the largest value of deals. However, what you actually need to look at is conversion rate. Your best sales rep is the person with the highest percentage of Won deals.
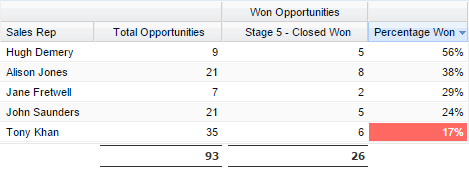
From the above you can actually see that Hugh wins the most deals based on his number of opportunities. Although Tony has brought in the largest value of deals he actually has the worst conversion rate (17%).
Tony has the highest number of opportunities in his pipeline. So maybe he is closing the highest value of deals because he has more opportunities to work through. Tony’s conversion rate needs to be improved, perhaps some of his open opportunities should be passed to Hugh who is more likely to win them?
You will also see that Jane has the smallest number of opportunities so no wonder she is not hitting target. Could you move any of the territories around or distribute the opportunities more evenly between the team?
This report also gives you an overall conversion rate. You can see that you won 26 out of 93 deals, or 1 in every 3.6 deals (28%). This metric is key when you look ahead into next quarter.
Not only do we need to worry about hitting the numbers for this quarter, we need to ensure we have enough in the pipeline for next quarter also.
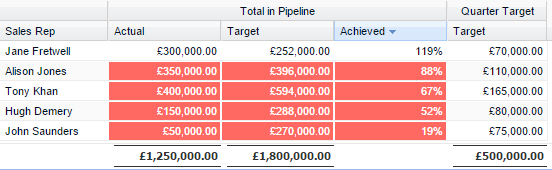
If you win on average 1 in every 3.6 deals (from report 3), you ideally want your pipeline for next quarter to be 3.6 x bigger than the sales target. In this example your sales target for next quarter is £500k, so your pipeline target is £1.8m.
You’ll notice from the above that the only person who has enough in their pipeline is Jane as she has £48,000 above her pipeline target (119%).
If you take your total Pipeline Target of £1,800,000 and subtract what you actually have in the pipeline £1,250,000, you have a Pipeline Delta of £550k.
This suggests you need this much extra in your pipeline to be likely to hit your target based on your conversion rates or you need to improve your conversion rates. Maybe Marketing could deliver some more leads?
Elegant responsive website, twitter and facebook are all great but are Marketing actually generating enough leads for the sales team?
As a sales leader you should be setting your marketing team targets, just like you set your sales reps targets. Ideally you should agree what constitutes a Marketing Qualified Lead (MQL) as not all leads have the same value to the business. If you only sell in the UK and Europe, lots of leads from Asia isn’t going to help your team. The MQL leads are the ones you need to measure and you want passed to your sales team.
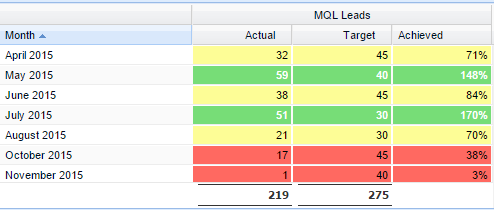
Workbooks CRM makes it easy to track leads. You can capture leads directly from your website, import them from spreadsheets, or integrate Workbooks with email marketing or marketing automation platforms . You can also build lead scoring and categorisation rules so leads are appropriately prioritised.
In the above report, you can see that marketing seriously missed their target for October and things are not looking much better for November. This is affecting your pipeline and may well explain the £550k shortfall. Having this visibility means that you can discuss a plan of action with the Marketing Team.
We already know that it’s much harder to win a new account than it is to sell to an existing client.
But do you really know which of your clients have stopped purchasing and may have moved to your competitors?
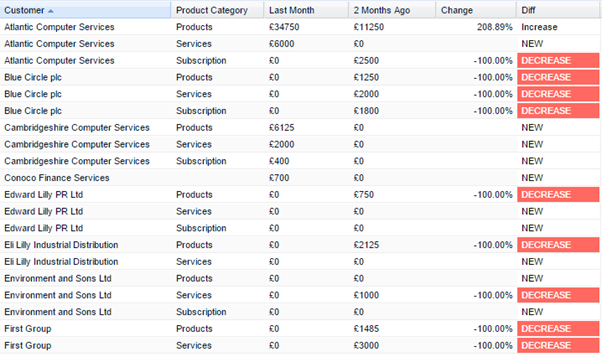
This report identifies your clients buying patterns over time. You can see which clients are new, which ones are increasing their spend and which ones have stopped buying all together.
This report built using Workbooks CRM relies on having order/invoice data inside your CRM platform. Workbooks makes it easy to either process orders and invoices inside your CRM system or integrate the data from an ERP or accounting system.
You can see that Blue Circle plc and First Group have not bought anything in the last month, questions to be asked could be:
If you only have a few reports that you look at regularly, these should be it!
You can be confident that you are fully aware of your team’s performance and how your pipeline is shaping up. You can see who is likely to meet their targets – or not.
The insight those reports provide should help you make the right decisions and take the right actions. Build upon them and you should be able to dramatically grow your business.
Do you want to know how to do this with Workbooks? Find out here.