
Customer Forum
How to create a report showing your opportunity conversion rate
| Posted: 2015-09-02 09:08 |
|
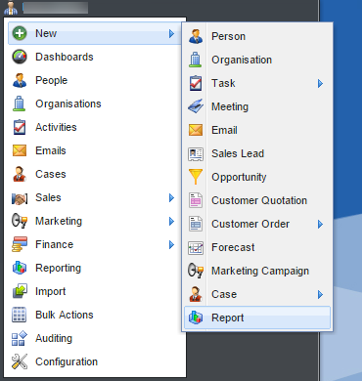
In this tutorial we will run through how you can create a report that will show you your opportunity conversion rate. This is an important KPI that will have an impact on many businesses that use workbooks. 1. Create a new Blank Report: Click Start > New > Report > Create a new blank report.
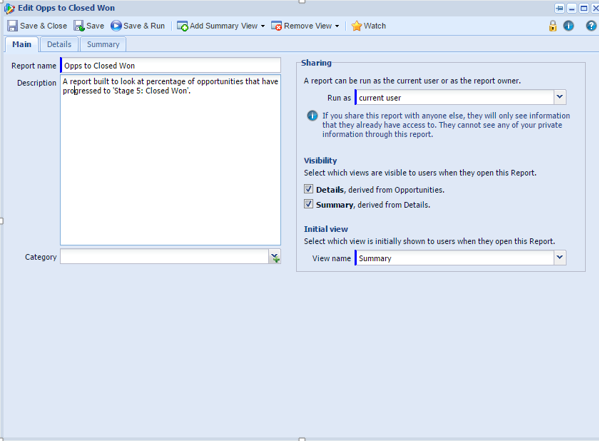
2. Choose Record type - in this case the record type will be 'Opportunities'. As always give an appropriate name - it is advised to also give a brief description in the appropriate box. This should allow for ease in finding appropriate reports when there is a number to choose from.
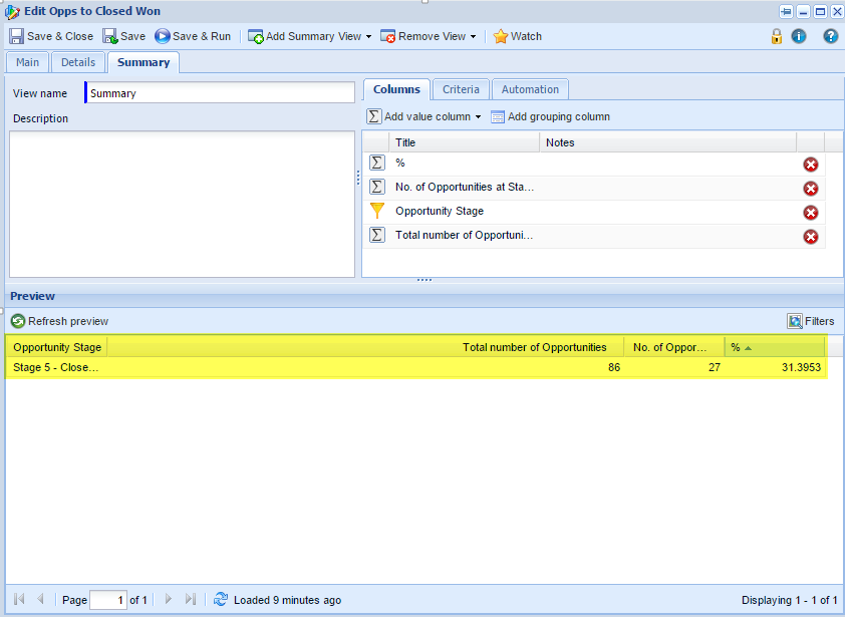
3. Select the 'Details' tab and input columns that will house the data you wish to build a report around. In this case it is appropriate to select 'Opportunity Stage' and 'ID'. Although names can be useful in many reports, they will not be of great use in this report. 4. Click Add Summary View, so that you can calculate the number of Opportunities at 'Stage 5: Closed Won' and compare it with the total number of Opportunities. 5. Click Add value column > Value column and select the Opportunity Stage from the picklist next to Column. 6. Now create a calculated column to count the total number of Opportunities by clicking Add value column > Calculated column and using the following formula:
7. Now add a calculated column to show how many of these Opportunities are at 'Stage 5: Closed Won', using the following formula:
With these two calculated figures it is a relatively simple task to calculate the percentage of Opportunities at Stage 5 compared with the total number of Opportunities in the database by dividing the number at Stage 5 by the total number 8. Add a calculated column using the following formula:
NOTE: We've multiplied the calculation by 100 to generate a percentage figure. You may also want to control how many decimal places are shown and include a percentage symbol in the report, in which case, click on the Advanced tab on your calculated column and use the dropdown picklist next to Display as to select 'percentage' and the picklist next to Decimal places to control the number of decimals displayed.
For a more in-depth report it may be appropriate to build a report that incorporates Auditing data. This will allow for the user to create a report that shows how many Opportunities have been converted in a given time period or by a certain person, etc. |
| Posted: Thu, 06.05.2021 - 13:59 |
|
I think the formular above COUNT(DISTINCT IF( PARENT('Opportunity Stage') = 'Stage 5 - Closed Won', PARENT('Id'), 0)) should be COUNT(DISTINCT IF( PARENT('Opportunity Stage') = 'Stage 5 - Closed Won', PARENT('Id'), null)). Using "0" as as value in the If-then-else logic actually causes the 0 to be counted as a distinct value, where null is ignored. See example here: https://www.workbooks.com/node/1640 |
- Log in to post comments