
Customer Forum
Reading process logs
| Posted: 2021-06-21 18:12 |
Reading process logsBeing able to read your own process logs is really useful for understanding what caused an issue so you can set out an appropriate series of steps to resolve it and make sure it doesn’t happen again. Logs detail every step that a process takes when it runs, and can be found in one of two ways. Either under Start > Configuration > Automation > Processes, and then the logs tab on the relevant process, or under Start > Configuration > Automation > Process Logs. How much information you can see in the logs depends on both the script Engineer who wrote it, and the log level on the process. By default, if a process fails, it will automatically use Debug, the highest log level, but under normal operation, unless this is manually switched on, you will only see Info logs. These are the logs that have been baked into the script itself by the author. 
As an example, info logs will usually be quite concise, like this: 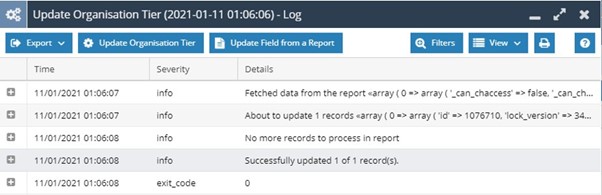
Whereas debug logs will look more like this – you can see the individual API calls being made: 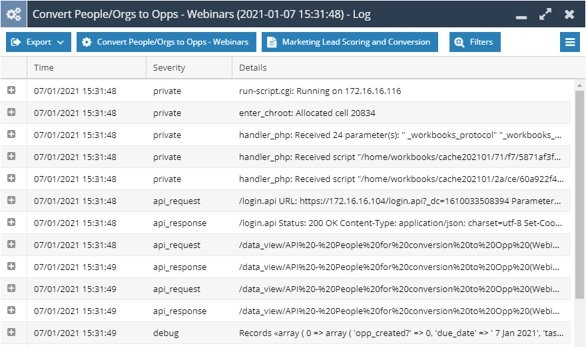
You will notice that API requests and responses always come together in a pair. The request is what the script is asking of the API, and the response is what the API is feeding back to the script. From left to right we have the timestamp, the severity (log type), and the details of what exactly the process was doing. Diving into the Details column of a log, the first section will show what record type is being worked on. So, in this example, we make changes on activities and people records: 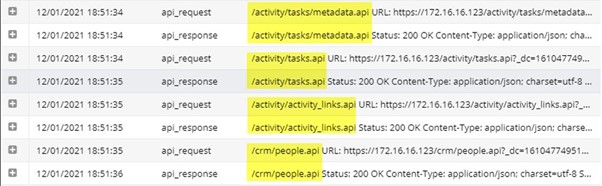
If you expand a line using the plus icon on the left-hand side, a window like this will open with more detail about the nature of the request: 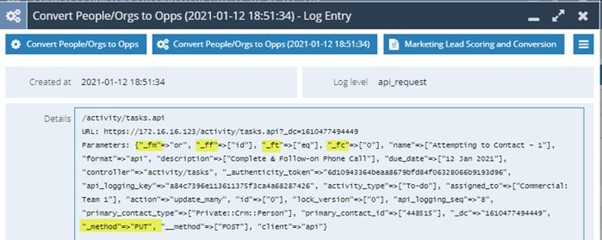
Highlighted are some details of what ‘filters’ are being used. You can also see whether this was a GET or a PUT request. These are fairly self-explanatory, a PUT means you’re creating or updating records, and a GET means you’re retrieving information from the API.
Each of these filters has a different function:
There are a few other helpful commands to look out for:
More information on this can be found on our Github, available here (https://github.com/workbooks/client_lib#filtering-types) To summarise, here we’ll take everything we’ve learned and convert this process log into plain English: 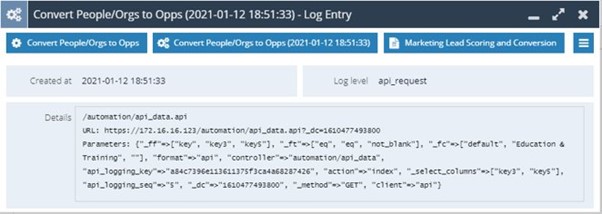
You can see on the first line that the record type is API Data, on the last line that the method is GET, on line 3 that the filter is “Key = ’default’ AND Key 3 = ‘Education & Training’ AND Key 5 is not blank”, and on line 5 that we’re selecting columns Key 3 and Key 5. So putting it all together we have: ‘Fetch me Key 3 and Key 5 from all API Data that match Key = ‘default’ AND Key 3 = ‘Education & Training’ AND Key 5 is not blank’. Simple, right! As always, if there are any further queries on understanding process logs please contact support@workbooks.com |
- Log in to post comments