
Customer Forum
Showing your top ten report results
| Posted: 2017-03-15 13:16 |
|
This post will run you through how to edit an existing report and change the display to show only the top ten results within that Report against a specific criteria.
Why would I want to see this? It will allow you to see vital information at a glance, showing you where your attention is most needed. It is also useful where you have limited space, for example if you display reports on a TV screen. This change can be applied to all Report types but could be most effective where you want to highlight information that will stand out or make an impact. Reports that you may benefit from this report view are:
Additionally, this report could then be published on a dashboard to make it publically available for where you want to highlight this information.
How do I create this view? This is a very straightforward change to make to an existing Report which we have outlined below, the same step can also be added when creating a new Report.
Step 1. Edit the Report Navigate to State > Reporting and select the Report you want to edit, do this by selecting the pencil icon on the right hand side of the page.
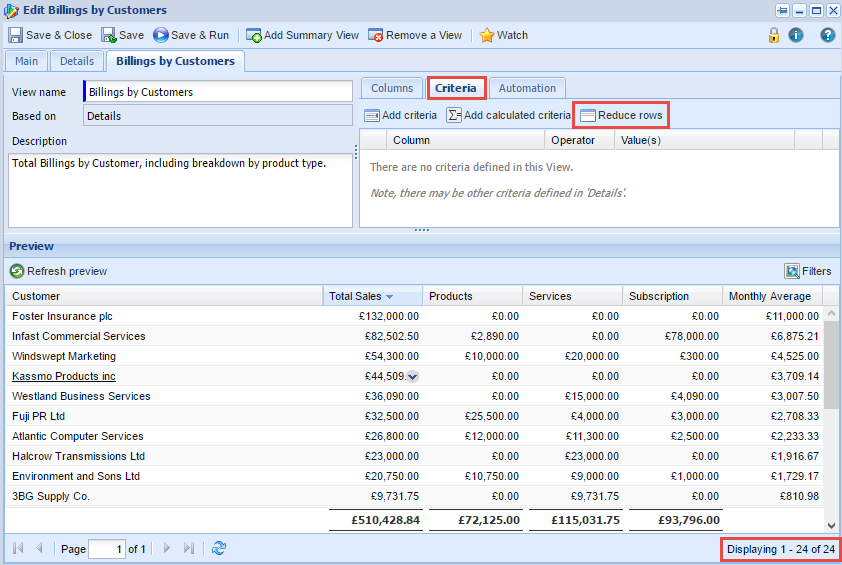
Step 2. Change the Criteria Once you have opened the Report select the Criteria tab and then choose the Reduce rows button.
We can see in this specific example that the report is showing 24 results.
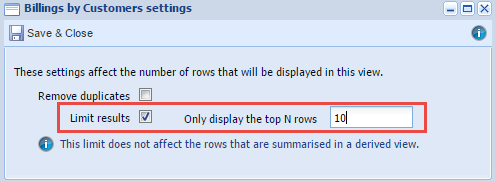
Step 3. Limit the results displayed Once you have selected this button you are given the option to Limit results, tick this box and then enter the value of how many rows you want to show, in this case 10.
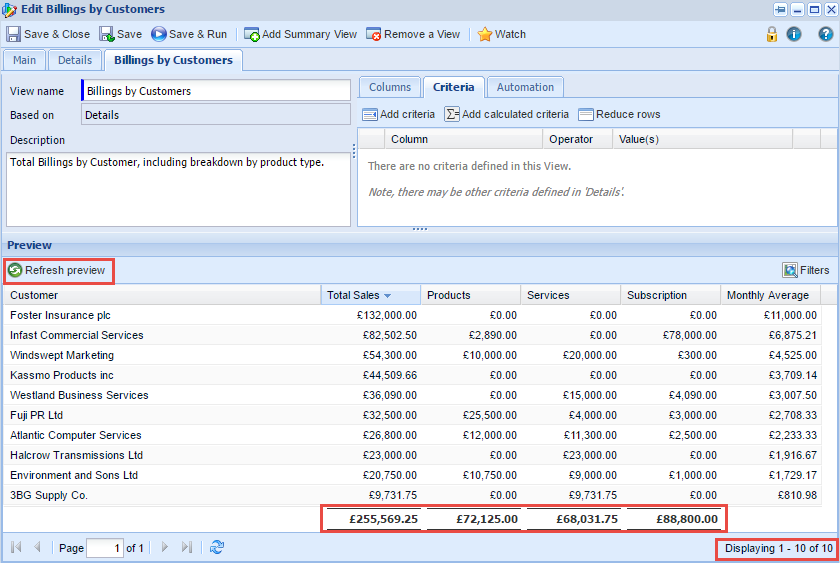
Save & Close this once you have made your selection and then Refresh preview.
Now that we have refreshed the preview you can now see that the Report is only displaying the top ten rows by Total Sales, additionally the subtotals for each column has been adjusted to only reflect the figures that are on display.
|
- Log in to post comments