
Customer Forum
How to create a report showing the average time it takes to close a deal
| Posted: 2015-09-02 09:41 |
|
Did you know? There are two methods that we can use to calculate the average time it takes to close a deal; each of which are documented below.
How to create a report showing the average time it takes to close a dealIn this guide we will use the difference between the close date and the date the opportunity was created as a measure of the time taken to close the deal.
Step 1) Create a report based on Opportunities. Add in 3 columns:
Step 2) Now we will need to add a calculated column. Use the following formula:
This column will allow us to see the difference (in days) between the date that the Opportunity was created, and the date that the Opportunity was closed.
Step 3) Add a Summary View, then add a calculated column called Time to Close (days). We'll use the formula below to get the report to look for the average of your "Time to close" column. The formula for this is:
NOTE: "Time to close (days)" is the name of our calculated column. You can have a different name if you prefer but remember to change it in your formula.
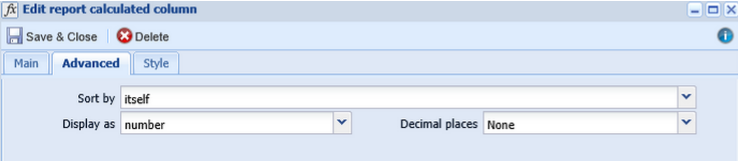
Step 4) Click the Advanced tab, and you will need to set "Display as" to Number, and decimal places to "None", if you wish your number of days to be shown in full days.
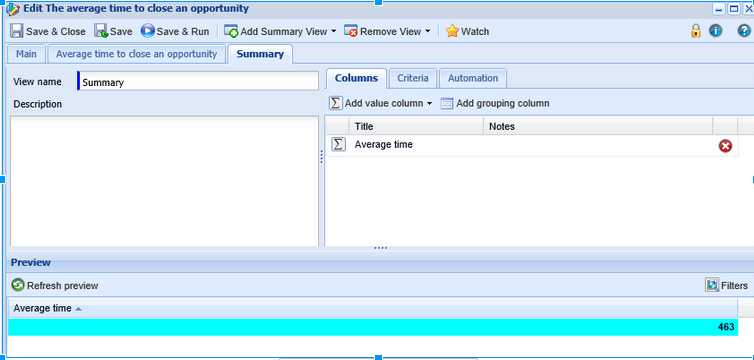
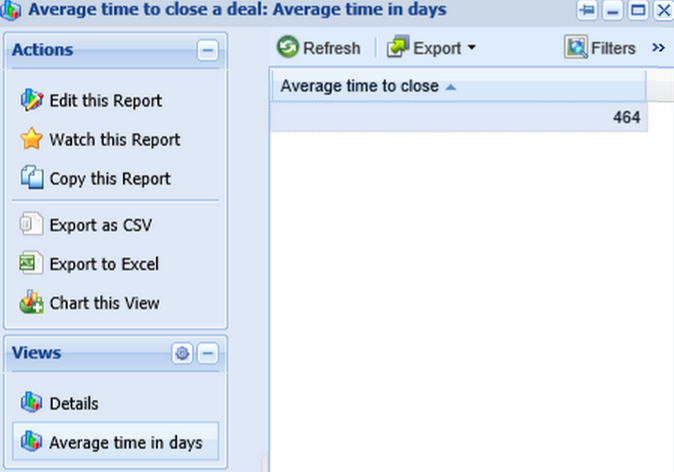
That's it! You should now see the report below:
You can see the average time taken to close the Opportunities in this sample data is 463 days.
Calculating the average time it takes to close a deal using audit reportingIn this guide, we will use a more in-depth form of reporting called "Audit Reporting", to provide more accurate figures of the close date by drilling into the Audit Records. NOTE: this will only work if you have purchased and are using the Audit module.
Step 1) Add in your first two columns that will be needed (in this case, it is "Created at" to tell us the date the Opportunity was created, and then the "Opportunity name".
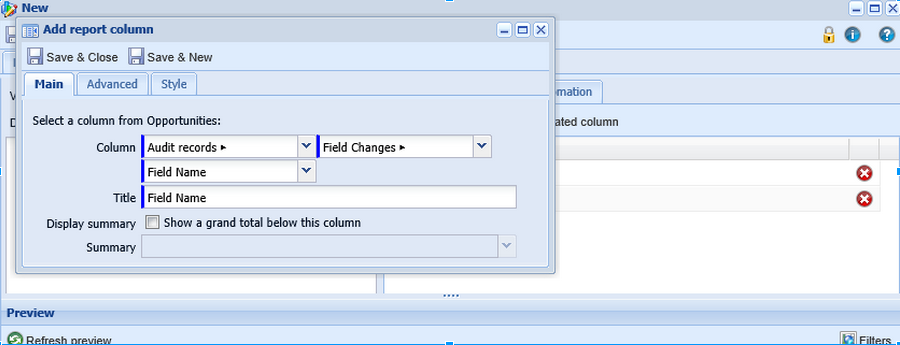
Step 2) Now that the basic columns have been set up, we need to add some additional columns for Audit data which show the changes made. The three columns that we will need to add here are "Field Name", "New value" and the "Created at" Audit Record. You can add these by clicking Audit records > Field Changes within the add column menu.
It is important to note, that the "Created at" date from the Audit Report, will in fact be telling us the "close date", since this refers to the date that the Record was changed from Open to Closed. For the purpose of this tutorial, I have named the "Created at" audit record column as the "close date".
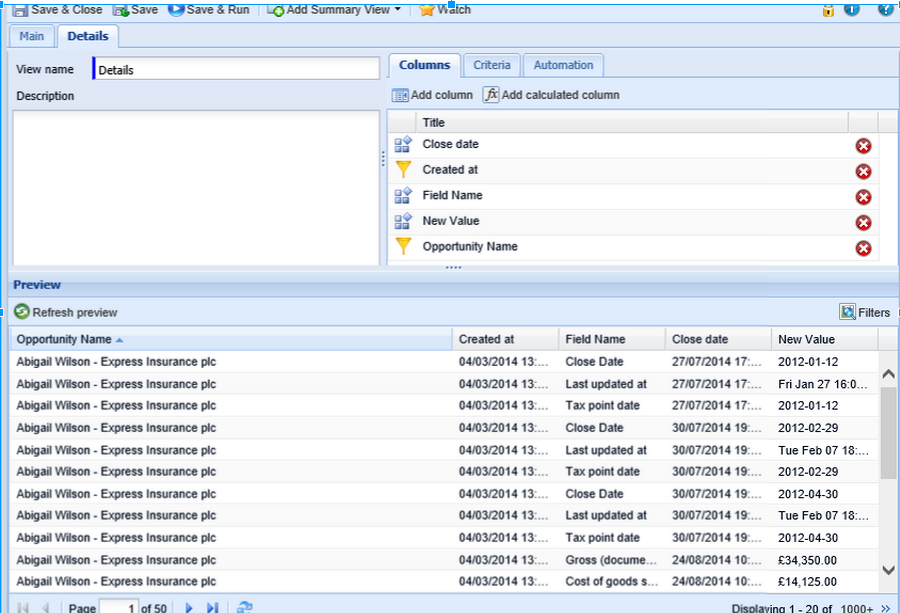
Step 3) As you can see below, we are now left with 1000+ rows - this is because our columns are currently looking at every change to the Records, as opposed to simply the changes that we want to see, therefore we will need to add some criteria to filter the records down.
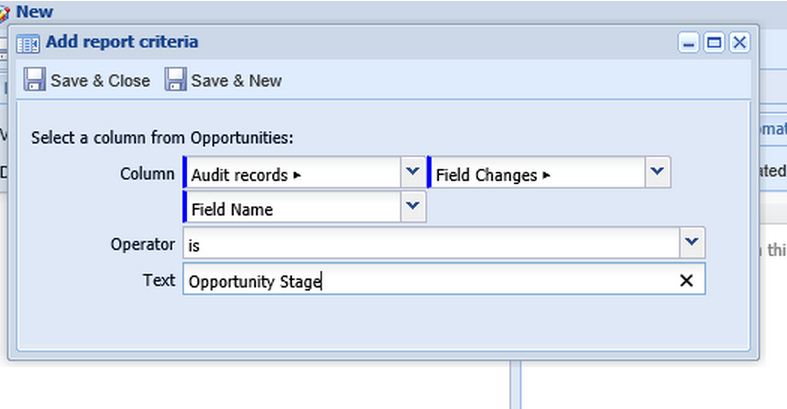
Step 4) The first criteria that we want will limit the report to only the rows that have the Field Name "opportunity stage", so that we only see records relating to the changes in the stages.
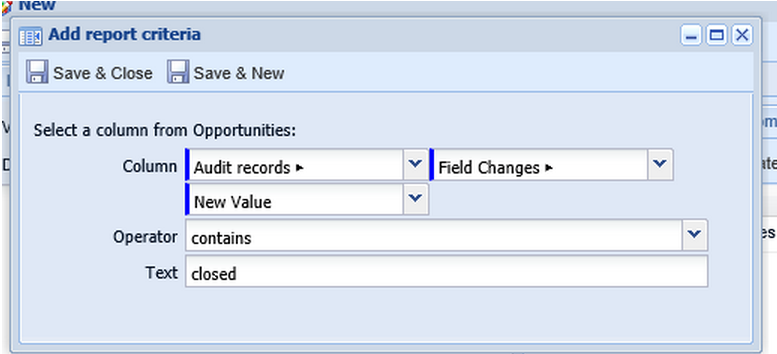
Step 5) The next criteria that we need to apply is going to focus on the field value. Since we are not interested in any other stages that the Opportunities went through in this report, as all we are looking for is closed Opportunities. By setting the criteria to only look for new values that contain "closed" we can focus solely on relevant records.
With the criteria now applied, we have reduced the amount of results in this test data from "1000+" to just 6 rows.
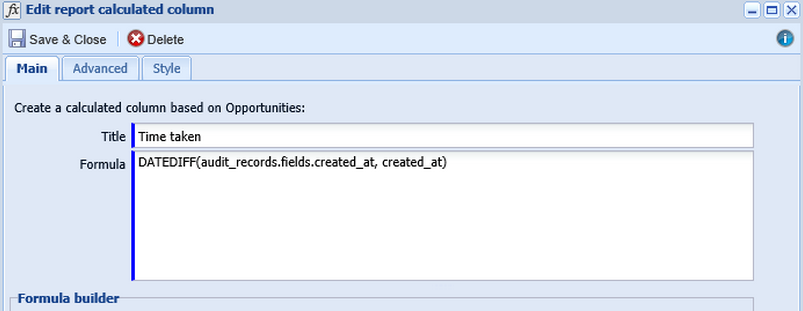
Step 6) Add a calculated column using the formula:
The first column we will be adding is the "Created at" column from the audit records [NOTE: Even though this column is called "close date" in the report, when telling Workbooks what to do it will be referred to by its default column name]. The column that we are comparing the close date against is the standard column "created at" - remember to separate the two fields by a comma and a space, and to close the brackets.
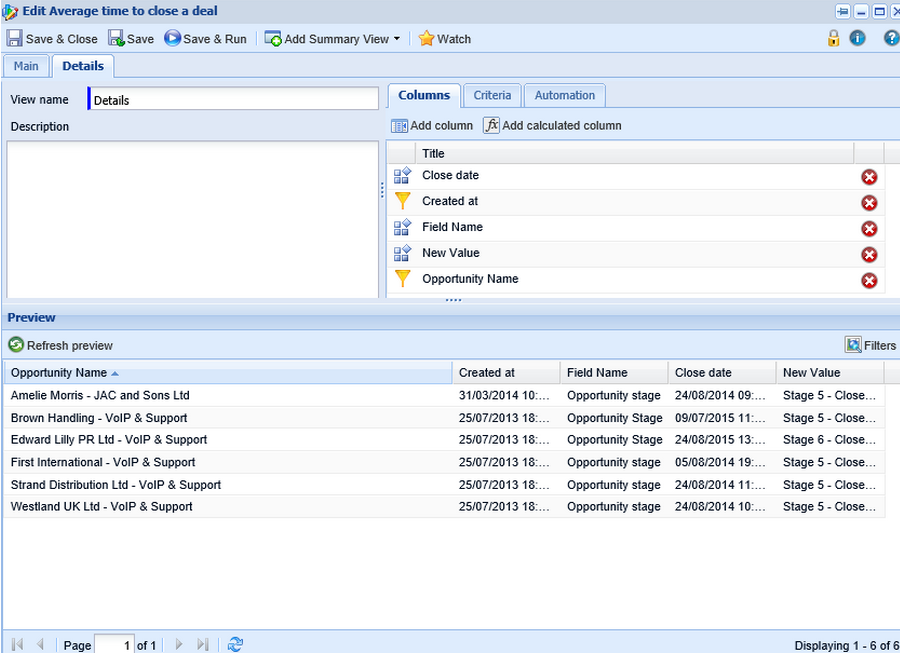
Step 7) We now have a column that tells us the time taken in days (see below) to close the given opportunities. We want the to report to show the time to close as an average, so there is one additional step.
Step 8) Add a Summary View and then a Calculated column using the formula:
NOTE: "TimeTaken" is the name of our calculated column from the Details view. You can have a different name if you prefer but remember to change it in your formula. The report now shows the average time in days to close an Opportunity:
Interested in more reports like this? Check out this blog post. |
- Log in to post comments