
Customer Forum
Data Analysis of Workbooks Data using Qlik Sense
| Posted: 2018-10-22 13:01 |
|
Please note: Workbooks is not affiliated with Qlik, and therefore does not offer support for Qlik products. This forum post simply highlights what can be done. Qlik release software updates periodically, these instructions were written using Qlik Sense Desktop (Sept 2018 version) and were correct as of October 2018. You will also require the necessary licences to use the Qlik Sense Web File functionality in data manager which at the time of writing, was included free of charge.
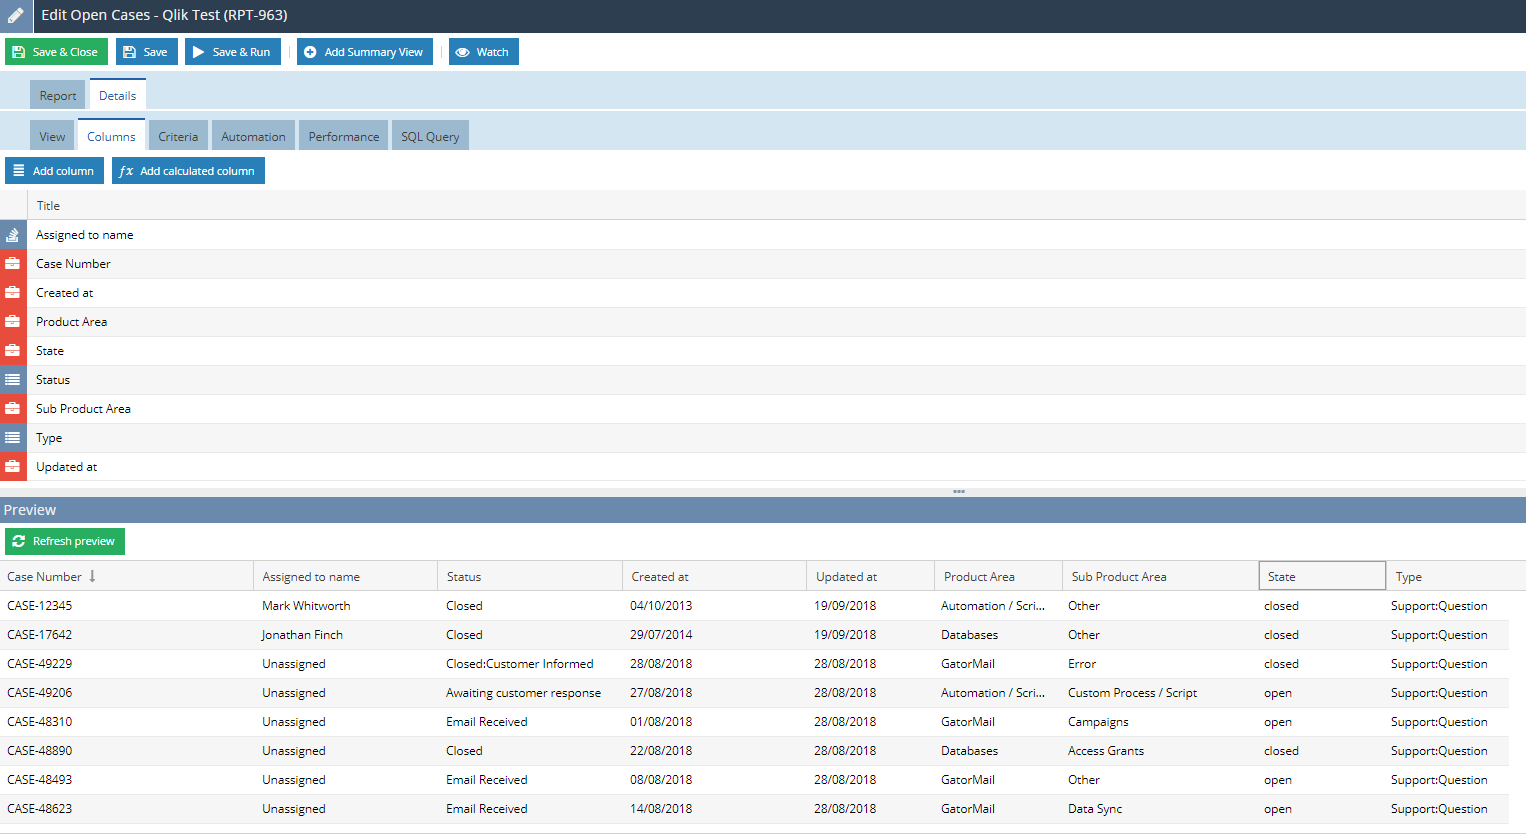
The Workbooks API can be used to retrieve data from your database in the form of individual records, or a collection of different record types using multiple API calls or a report. For simplicity, this forum post focuses around retrieving one single report based on Cases which drills through to a Primary Contact, and that contact’s Employer. Of course, you could extend this further or use different reports to suit your needs. In Workbooks, let’s start by building a simple report from a pre-populated report which gives the details of all our Cases. By default, this includes a list of support calls, professional services projects and so on. We can add as little or as a much data into this report as we need by adding columns and/or tweaking the criteria. I’ve added the Case Contact’s Employer, Case Type, Product Area and Sub Type.
For this example, we’ll add criteria to limit the Cases to just our support calls, by adding the following criteria:
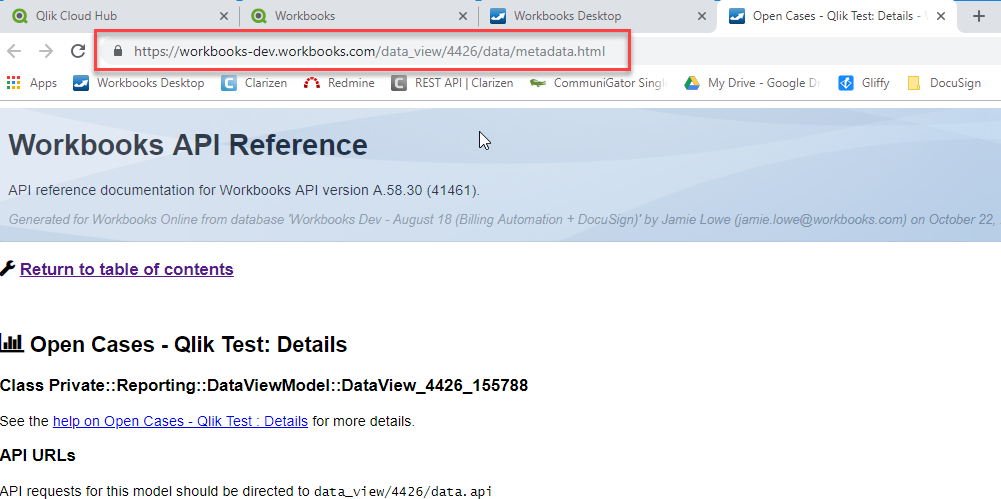
When you’re ready save your report, then click the “Automation” tab within the Report editor screen (next to the Criteria tab) and select “API Reference”. You’ll be presented with an HTML page that contains the details of your report. For this example, we don’t need anything from this page, other than the URL from our web browser. Copy and paste this into a notepad for now, you’ll need it later.
In Workbooks, navigate to Configuration > Email & Integration > API Keys. Either choose an existing API Key from the list or create a new one. In notepad, you need to append your chosen API Key to the URL you copied earlier. The URL should look like this before you make changes:
Amend the URL, by deleting anything after the 2nd instance of “/data”. You will need the number, as this is our reports unique ID. After removing the end of the URL, add the following text, replacing {YOUR_API_KEY}, with the API Key from Workbooks:
You should now have a URL like so:
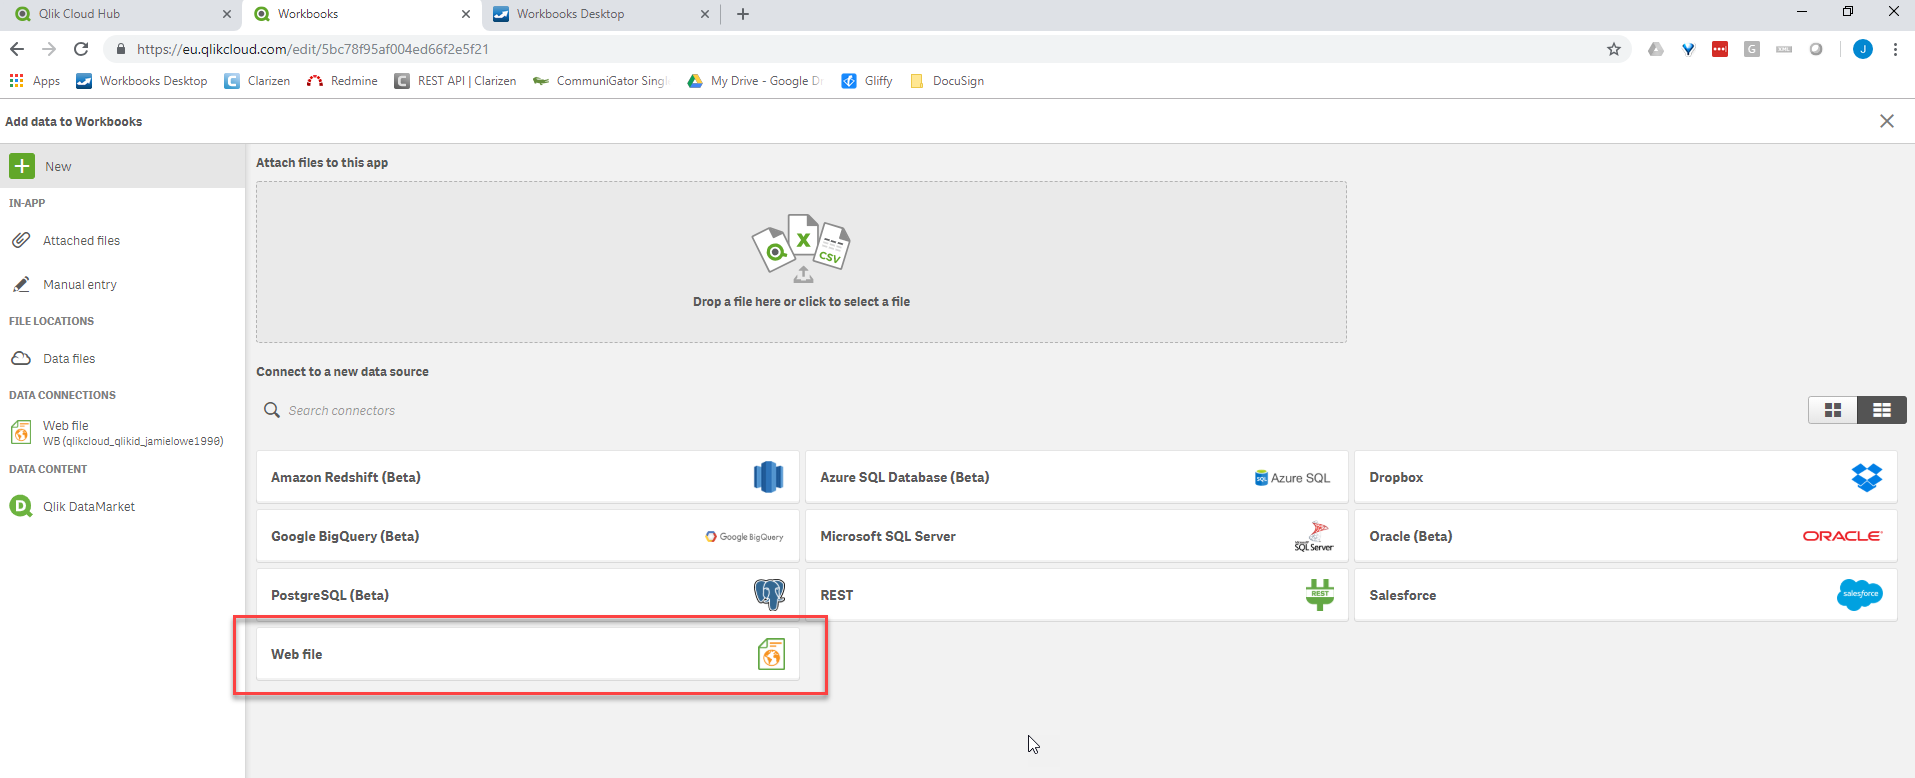
We can test this URL by pasting it back into our Web Browser. When you navigate to the URL, your browser should automatically download a CSV file of your chosen report. Depending on the number of results in your report, this may take a while to download. We’re now ready to start building our Qlik Sense app! Qlik SenseIn Qlik Sense, create a new app (or add this data into an existing app if you have one) and navigate to the data manager and select “Web File”.
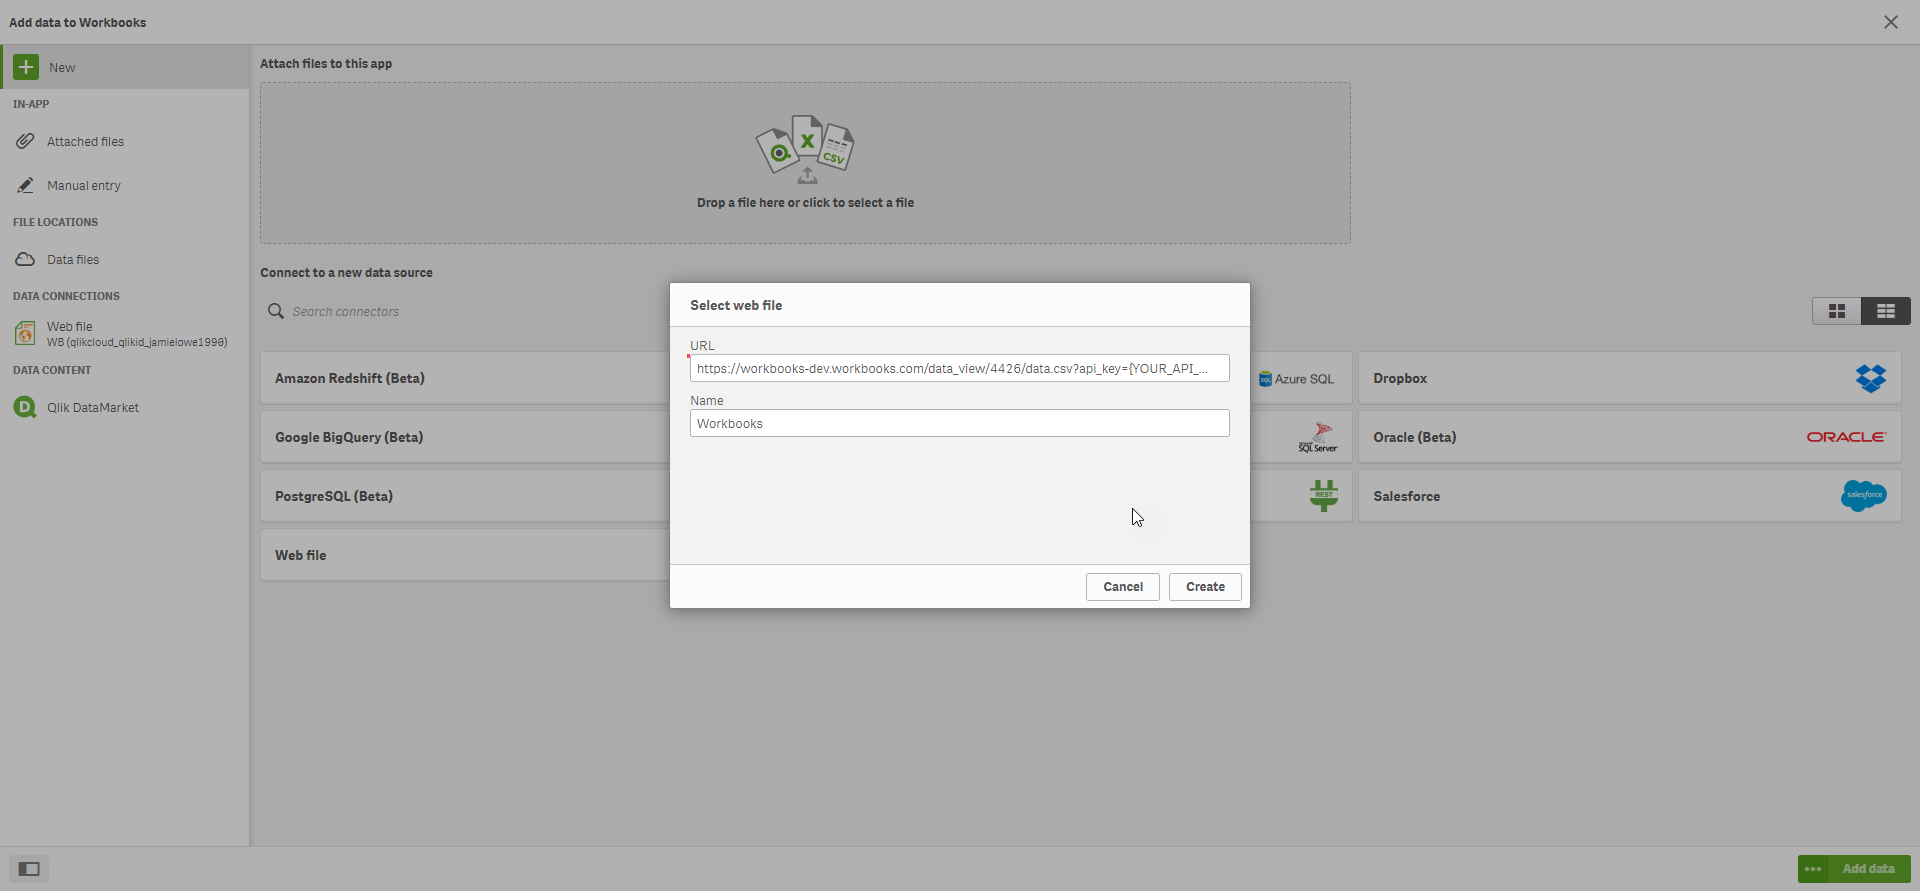
In the dialog box that appears, enter your URL from before and give the new connection a sensible name:
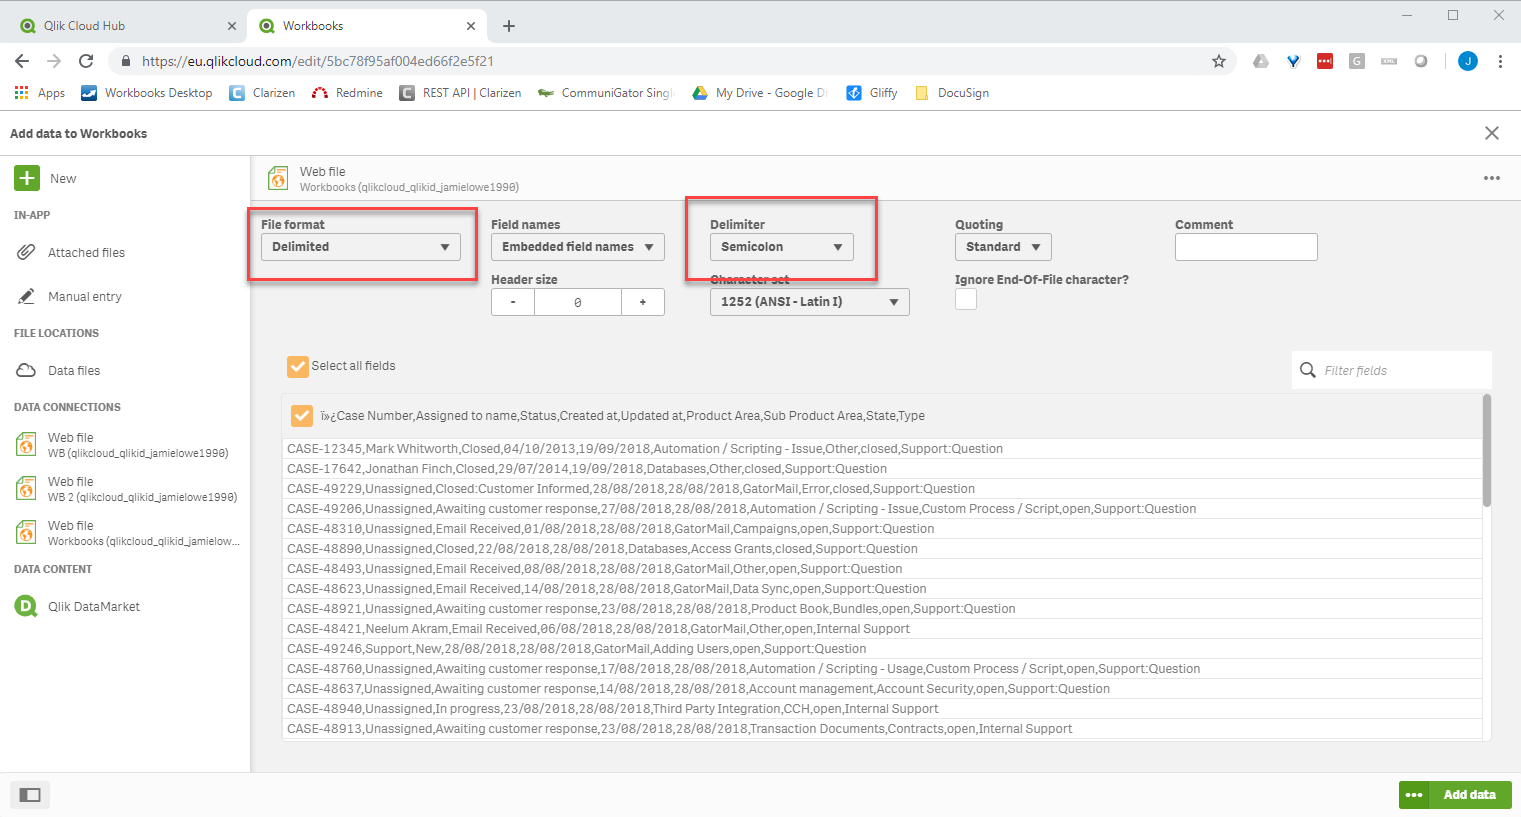
Qlik will now download the report’s data into its own internal storage so that you can build visualizations on it. Again, depending on the number of results in your report, this could take several minutes. When complete, you will see a preview of the report data in the data manager, but it will only display as one column. There are few changes we need to make to Qlik’s settings as follows:
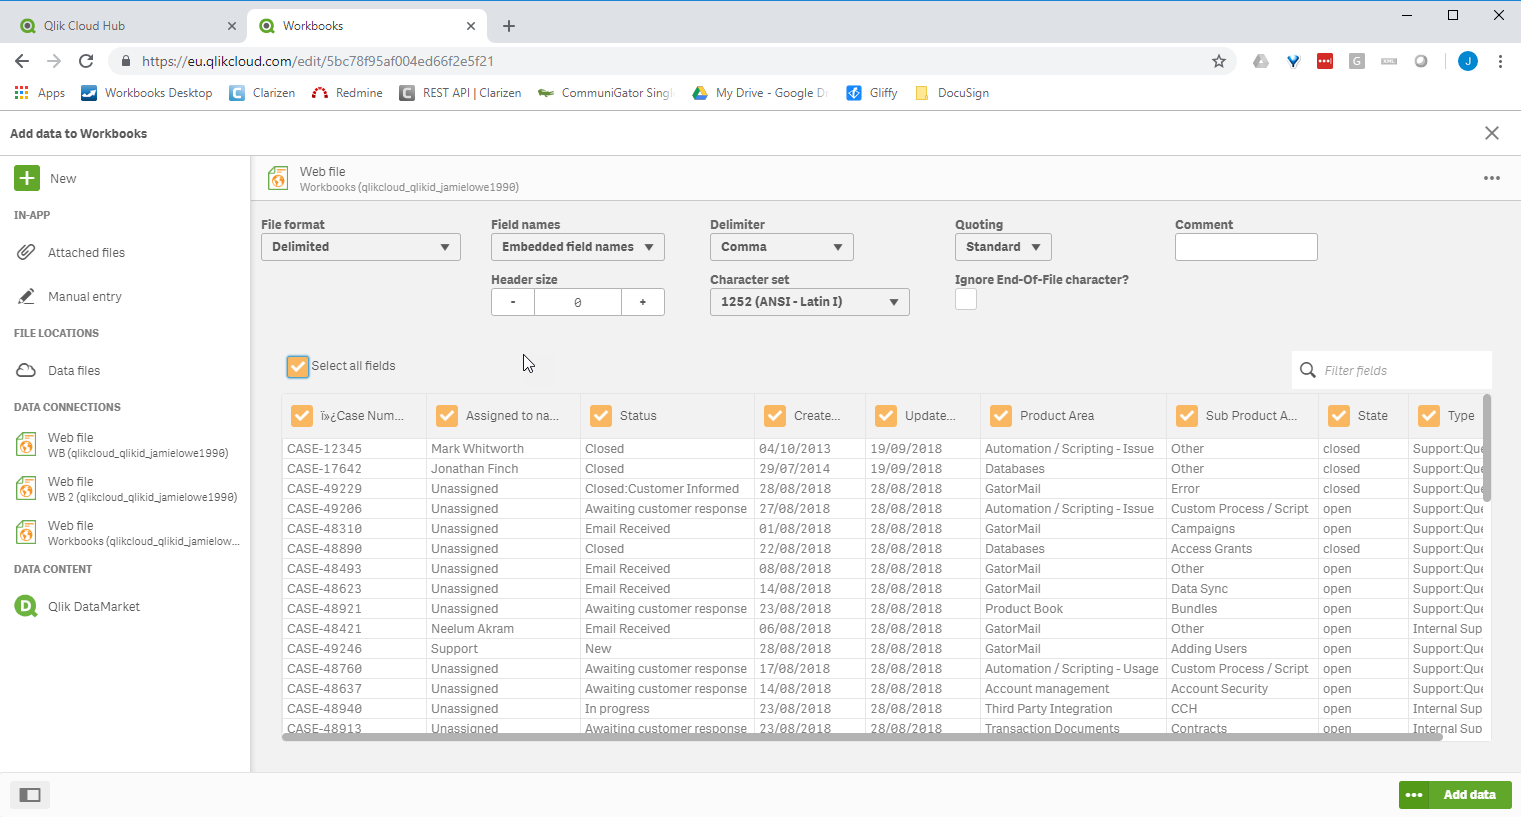
Once you have made these changes, the data manager should then display appropriate columns as per your underlying report in Workbooks. Using Qlik, you can rename the columns as required and/or select which columns you wish to bring into your Qlik Sense data model. For this example, set the “select all field” checkbox to true.
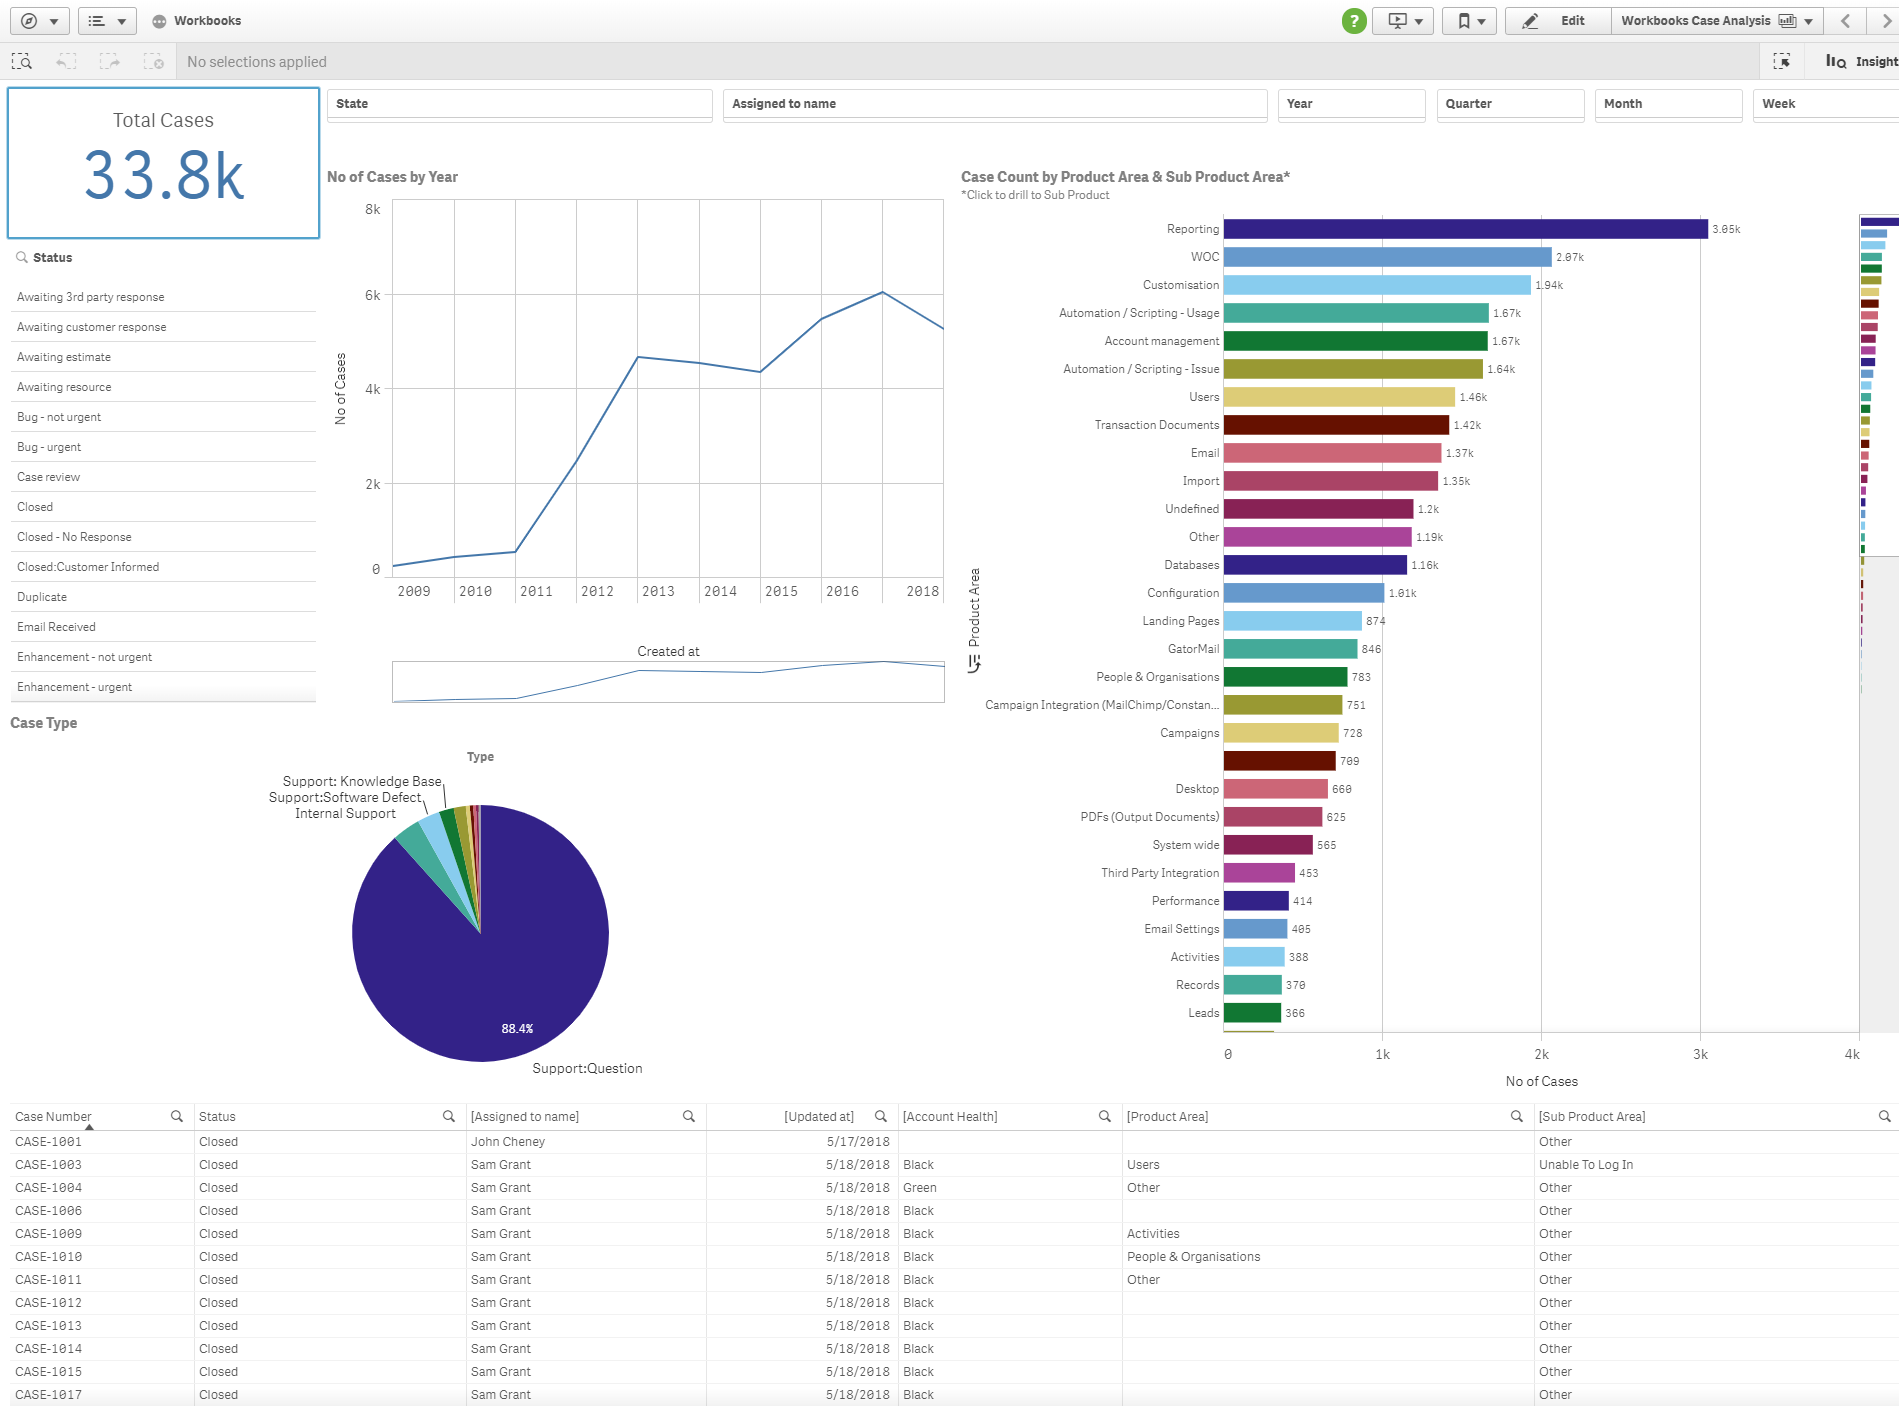
Click “Add data” when you are finished. Again, this may take a few minutes to load the full data set into Qlik Sense. In our example, we loaded around 35,000 Cases which took around 5 minutes whilst using Qlik Sense Desktop. However, this may vary depending on the volume of data in your report and how the report has been built. That’s it! From here, you can start to build out any visualizations you need. In this example, we’ve created visualizations as follows:
You could get more creative and take this further by adding in other reports if you wish and join them together. For instance, you could build out a list of People employed by your Own Organisation, with details of their Job Title, Skillset and Length of Service to really bring this data to life. |
- Log in to post comments