
Customer Forum
Seeing sub-totals and totals on one report
| Posted: 2011-06-06 12:22 |
|
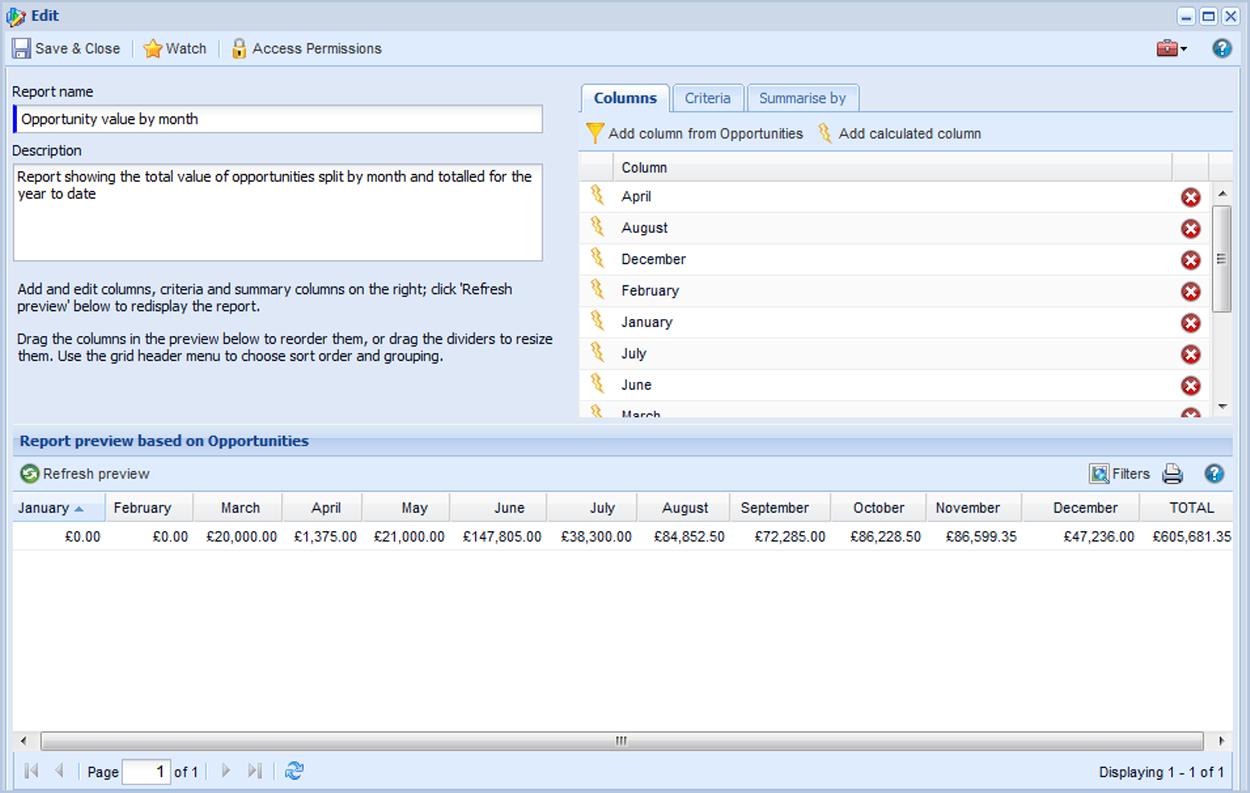
I can create a report that shows the total opportunity amount for each month but can't work out how to show the overall total too. Here's a screenshot.
|

| Posted: Tue, 07.06.2011 - 08:39 |
|
There is a way to show the total for each month AND the grand total, which is achieved by showing the months as columns rather than rows. This involves creating a series of calculated columns and once you've created one, it's easy to create the subsequent ones and simply amend the date, as described below. First, create a calculated column called January using the formula shown below: SUM(IF(DATE_FORMAT(close_date, '%M') LIKE 'January', amount,0)) This formula is doing three things: first of all it's examining the Close Date for the Opportunity and re-formatting the way it's displayed so that, for example, a Close Date of 01/01/2011 is displayed as January. Next, an IF statement is used, which says if the month of the close date is like January, then show the amount entered on the opportunity but if the month isn't like January, show 0. Finally, the values are added up using SUM so that the total for the month is shown. To make your report easier to read, remember to change the Display as option to currency. You should then create columns for the rest of the months of the year, substituting the word January in the formula above to reflect the name of the month for which you want to display a total. (You can copy and paste the formula into a new calculated column and just change the month name.) Once you've created columns for each month, you can create a column to show the total for the year, using the following formula: SUM(amount) Again, remember to select currency from the Display as dropdown picklist. Your report should now look something like the one in the screenshot below. (Click to enlarge.)
Finally, remember that this report hasn't been restricted to any particular time period so if you've been using Workbooks for more than a year, the month columns will show the totals for all months called January, February, etc. To limit your report you can apply a criteria to restrict the results to Opportunities with a Close Date in a specific calendar range or accounting period. Additionally, you'll probably want to restrict your report to Opportunities that have not been lost or that have reached a particular part of the sales cycle, which you can do by using criteria to limit the results to Opportunities at specific Opportunity Stages. NOTE: This report adds up the amounts for your Opportunities, which assumes all the Opportunities are in the same currency. If different currencies have been used, you can report on the value of the Line Items (in Home Currency) thus allowing you to add up all the values, regardless of currency. So, for example, to show the net total of Line Items in the Home Currency for Opportunities closing in January, you should use the following formula: SUM(IF(DATE_FORMAT(close_date, '%M') LIKE 'January', order_line_items.home_currency_net_value, 0)) |
| Posted: Sat, 19.10.2013 - 09:51 |
|
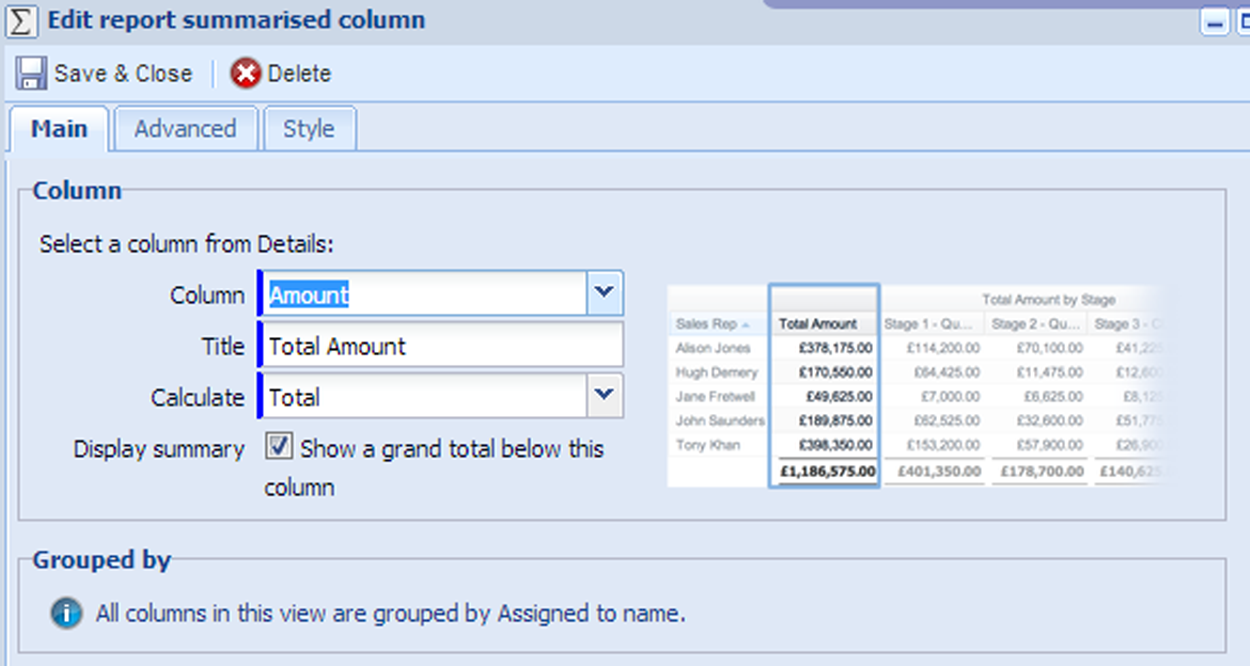
In the next release of Workbooks, due out in late summer, you can build the same report which also includes sub-totals. This can be done by undertaking the following steps:
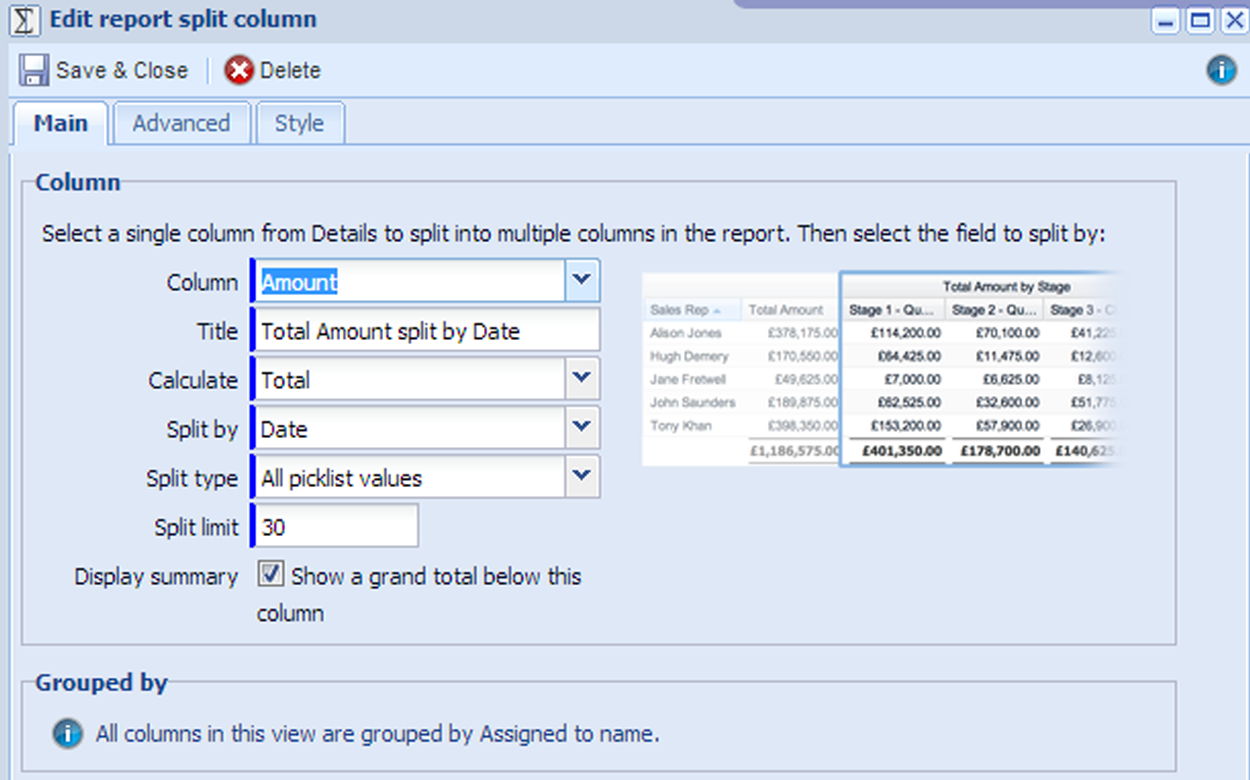
'DATE_FORMAT(close_date, '%M %Y')' The details view now shows a list of all Opportunities and their Close dates. A Summary View can be built to show the Value of Opportunities per month, per sales rep, with sub-totalling. To do this:
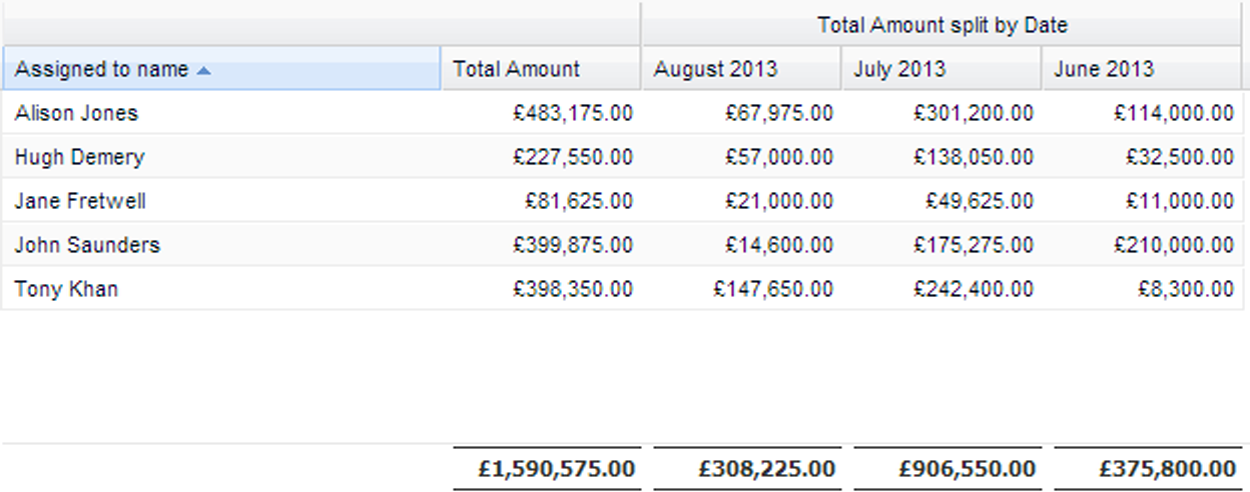
The report should look something like the one below.
Here you can see the Total Value of Opportunities for each rep and the grand total of these. You can also see how this figure is calculated, by breaking down the Months according to Close date. |
- Log in to post comments