
Customer Forum
Pipeline Stage Movement
| Posted: 2017-02-13 15:05 |
|
Prerequisite: This report uses the Audit Extension, and will not work if you’re not licenced to for this feature. Your system administrator will be able to confirm if you have this extension. OverviewThis forum post presents an Opportunity Report that helps provide visibility of “Pipeline Movement”, which helps you understand what’s happening in your sales pipeline. The report has 5 views, which show:
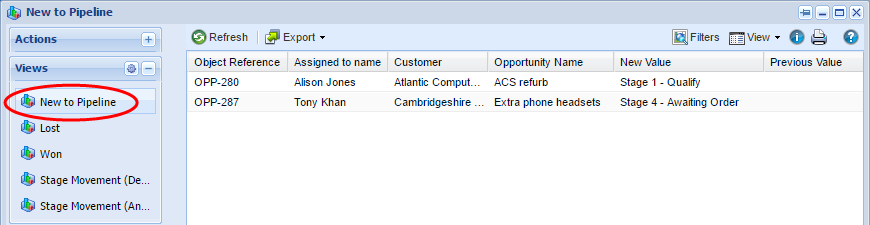
The New to Pipeline, Lost & Won views are all similar in appearance:
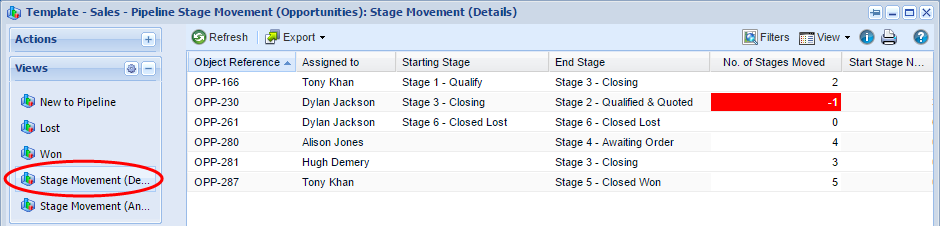
Stage Movement (Details):
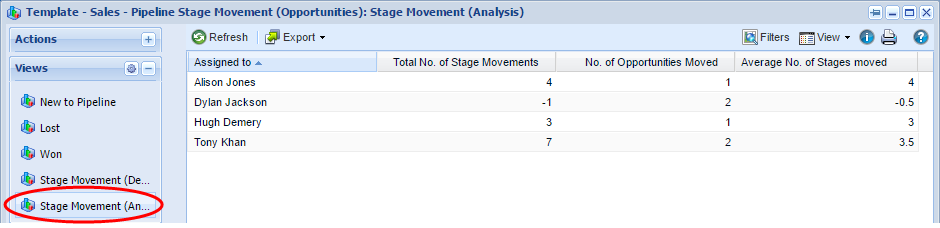
Stage Movement (Analysis):
Here’s an example of the report (which is available as a template report, named “Template - Sales - Pipeline Stage Movement (Opportunities)”) in action:
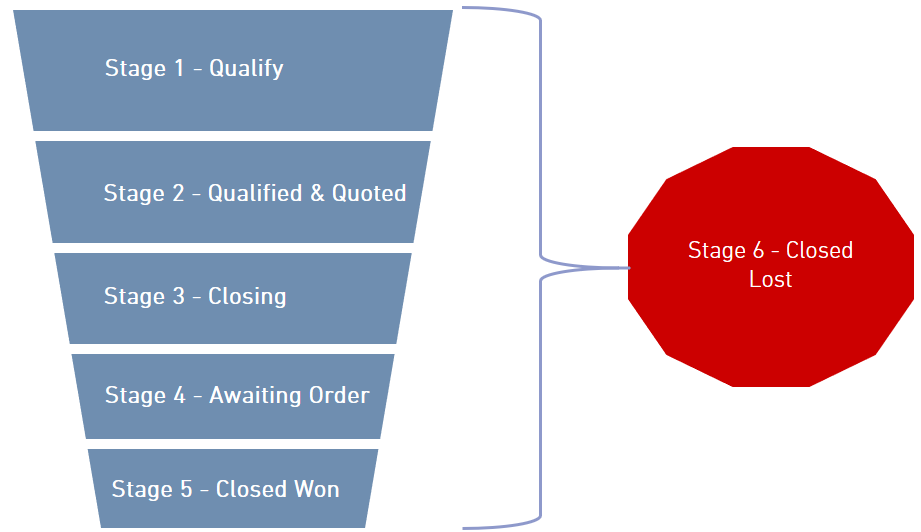
As discussed in our CRM for New Business Sales webinar (not essential to understanding this report, but well worth watching), it’s important to have a process and appropriate “Sales Stages” for the Opportunities in your sales pipeline. The example we provide uses these stages, which have a consistent prefix / naming convention: Stage 1 - Qualify Stage 2 - Qualified & Quoted Stage 3 - Closing Stage 4 - Awaiting Order Stage 5 - Closed Won Stage 6 - Closed Lost This graphic represents a sales funnel. “Stage 5 - Closed Won” is the natural goal, but opportunities can, of course, be lost at any stage within the sales process, or revert to an earlier stage e.g. A customer may change their requirements, which requires re-quoting, or further discussions with sales staff.
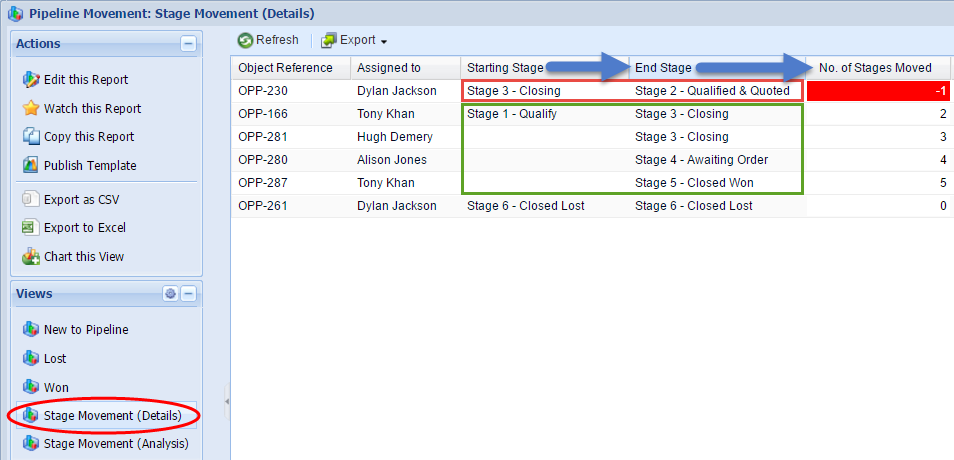
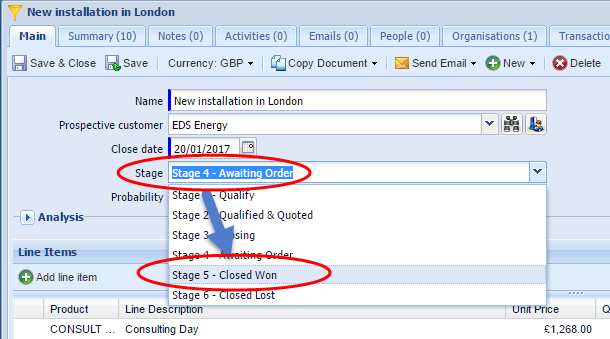
Salespeople manage Opportunities by changing the Stage as each deal progresses e.g. an Opportunity will be moved from “Stage 4 - Awaiting Order” to “Stage 5 - Closed Won” when the customer confirms they wish to proceed:
How do I build it?We’ve provided a Template Report (Template - Sales - Pipeline Stage Movement (Opportunities)). All you need to do is use the template, but we do of course provide more detail… Important: The first 7 characters of each stage name are “Stage n”, with n representing the stage number. This means the 7th character is always a number, which is used to perform arithmetic in a calculated column to determine if the Opportunity has progressed, not changed, or reverted to an earlier stage. Opportunity pipeline stages vary from business to business, and you can amend them to fit your own sales process, but this report will need to be modified if you use a different naming convention for your stages. The report only works if the 7th character of the stage name is a single number (1, 2, 3,..through to..9. It will need to be modified if you have 10+ stages, or use a different naming convention).
How does it work?The report uses Calculated Columns and formulae to calculate the Starting Stage and End Stage. The report also calculates the Starting Stage Number and End Stage Number, by finding the 7th character of the Opportunity Stage name. “Stage 5 - Closed Won” is a string of text, and it’s not possible to perform arithmetic on text. However, the 7th character is also calculated in a Calculated Column, converted to a number, and the Starting Stage Number is subtracted from the End Stage Number, which is displayed as No. of Stages Moved. Calculated Column code for No. of Stages moved:
CONVERT(MID(IF(LOCATE('|||', GROUP_CONCAT(PARENT('New Value') ORDER BY  PARENT('Audit Record Date time') DESC SEPARATOR '|||'))-1 <0,
GROUP_CONCAT(PARENT('New Value')), LEFT(GROUP_CONCAT(PARENT('New Value') ORDER BY PARENT('Audit Record Date time') DESC SEPARATOR '|||'),
LOCATE('|||', GROUP_CONCAT(PARENT('New Value') ORDER BY PARENT('Audit Record Date time') DESC SEPARATOR '|||'))-1)),7,1), SIGNED INTEGER)
-
CONVERT(MID(IF(LOCATE('|||', GROUP_CONCAT(PARENT('Previous Value') ORDER BY  PARENT('Audit Record Date time') ASC SEPARATOR '|||'))-1 <0,
GROUP_CONCAT(PARENT('Previous Value')), LEFT(GROUP_CONCAT(PARENT('Previous Value') ORDER BY PARENT('Audit Record Date time') ASC SEPARATOR '|||'),
LOCATE('|||', GROUP_CONCAT(PARENT('Previous Value') ORDER BY PARENT('Audit Record Date time') ASC SEPARATOR '|||'))-1)),7,1), SIGNED INTEGER)
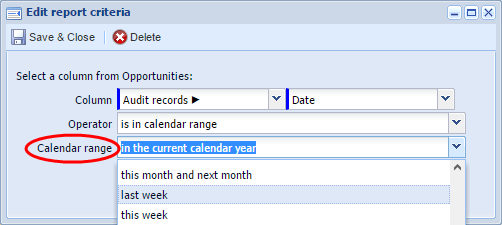
Obviously, this is a little unwieldy, which is why it’s probably easiest to start with the template, rather than create from new. The template report is available, and you’re very welcome to investigate / reverse engineer the formulae, but our Knowledge Base has several useful pages detailing the techniques used in this report: Note: The default criteria uses "is in the current calendar year", so you may wish to change this to "last week", or whatever Calendar range best suits your requirements:
This article explains how to use Calculated Columns to calculate the most recent description of an activity. The same principle is used in this template report calculate the starting and end stages of the opportunity, but instead of drilling into Activity data, the report drills from the Opportunity record into Audit data: |
- Log in to post comments