
Customer Forum
Pipeline Stage Duration
| Posted: 2017-02-17 16:31 |
|
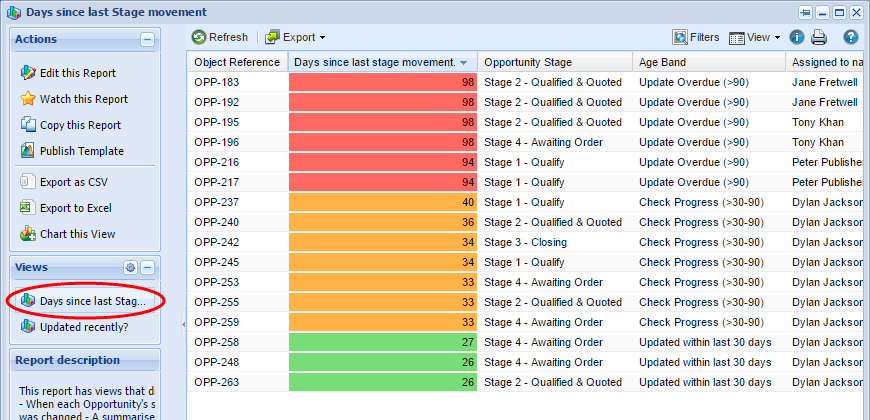
Prerequisite: This report uses the Audit Extension, and will not work if you’re not licenced to for this feature. Your system administrator will be able to confirm. OverviewThis forum post presents an Opportunity Report that helps provide visibility of when the Stage field of Opportunities is being updated, which helps you understand if opportunities are advancing through the sales stages / pipeline, or if they’re stuck (stage hasn’t changed for a period of time). The report has a Details view (which is intentionally disabled), plus 2 views that display:
The report is available as a template report, named “Template - Sales - Pipeline Stage Duration (Opportunities)”.
How do I build it?We’ve provided a Template Report (Template - Sales - Pipeline Stage Duration (Opportunities)). All you need to do is use the template as a starting point.
How does it work?The Details view of the report uses criteria to ensure the report only returns open Opportunities, and Opportunity Audit Data of changes to the Opportunity Stage field. The “Days since last Stage movement” Summary View used calculated columns and formulae to calculate the number of days since the each opportunity’s stage was last updated. The view is grouped by Opportunity Object Reference, which means only 1 row is returned per opportunity. This is essential, otherwise, you are likely to have multiple rows of data, with each row representing each change to the Opportunity’s Stage. As mentioned earlier, the report also allocates each opportunity into a band via a Calculated Column, which uses a SQL CASE statement. Note: CASE statements are a great way of sorting data into bands (categories) when there are more than 2 bands. An IF statement is ideal when you’re only categorising data into 2 bands. You can read more about working with formulae here: https://www.workbooks.com/reporting/reporting-1 Here’s what the code from the “Age Band” Calculated Column. The CASE statement organises the data into a band, and outputs one of 3 suitable text values e.g. “Updated within last 30 days”. You can amend or add to the number of lines / bands in the CASE statement:
CASE
     WHEN DATEDIFF(NOW(),MAX(PARENT('Date'))) > 90 THEN 'Update Overdue (>90)'
     WHEN DATEDIFF(NOW(),MAX(PARENT('Date'))) > 30 THEN 'Check Progress (>30-90)'
     ELSE 'Updated within last 30 days'
END
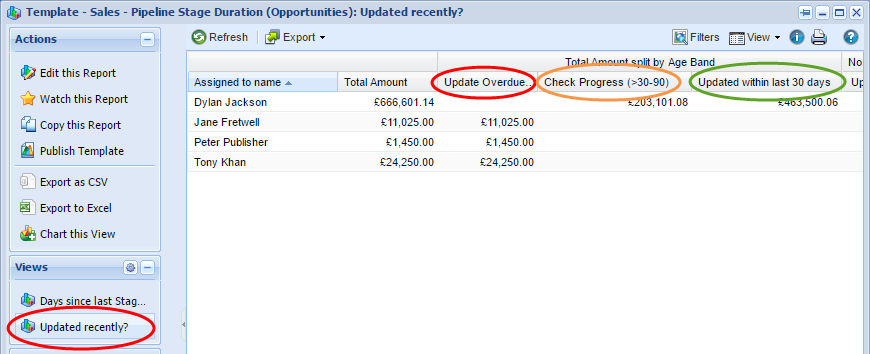
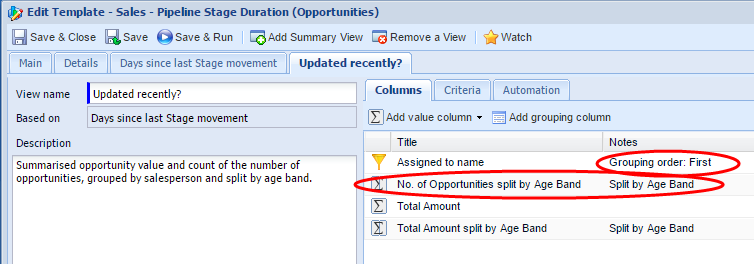
The “Updated Recently” view is a summary view based on the “Days since last Stage movement” view. It summarises the data by:
|
- Log in to post comments