
Customer Forum
How do I create a report with a count of records per month that's sorted in date order?
| Posted: 2011-02-15 10:11 |
|
Following on from the "How do I create a report that displays a record?" forum article, here's another that goes into greater depth, explaining how to group activities by month, and importantly, sort them in ascending or descending date order: A perennial problem with dates is the order in which they are sorted. Most dates are arranged in a dd/mm/yyyy or mm/dd/yyyy format. Both those formats of date sort easily, but when you re-format a date to display as a more readable format in a report e.g. February 2011, the ordering is alphabetical rather that by date. Consider the last 2 months of 2010 and the first 2 months of 2011 sorted in descending alphabetic order. It's not much use at all:
Fortunately it is easy to control the sort order in Workbooks reporting by adding a hidden sort column, which will achieve the desired result - a nicely sorted, readable and useful report:
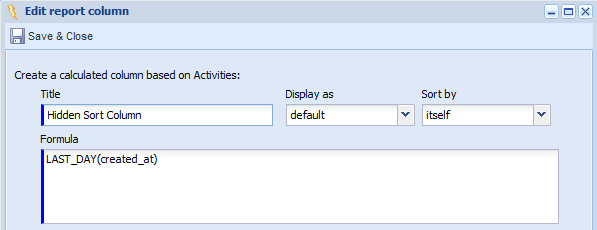
Solution: 1) Click the Add calculated column button and add the 3 following calculated columns. The third column will be used to control the sort order, but it will be hidden (not displayed in the report): Tally: Count(id)
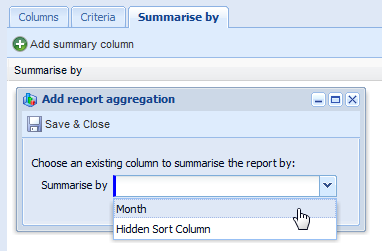
2) Click the Summarise by tab > Select Month > Save & Close
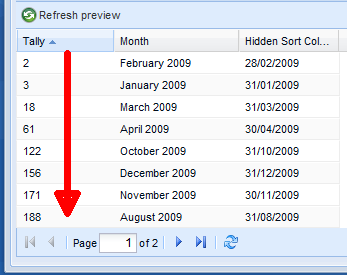
3) Click Refresh Preview. This generates a report sorted by the tally / count. Not what we want...
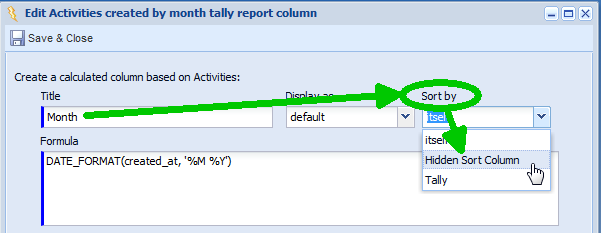
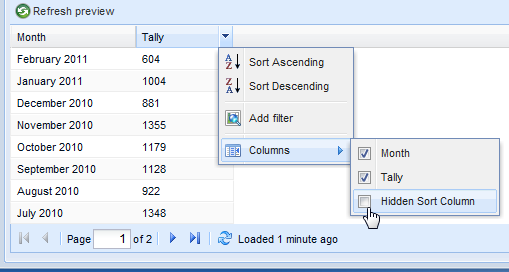
4) To sort the report by month, edit the Month calculated column to Sort by Hidden Sort Column, then click the Month column header in the report. This is really rather clever. Even though you click on the Month column header, the sort order is based on the Hidden Sort Column.
5) The final step is to hide the column so that you're left with the desired report. Simply uncheck the checkbox to hide the column:
This example is relevant to other reports, such as cases per month. Remember you can also add criteria to limit the number of records returned by the report. |

")
| Posted: Wed, 16.02.2011 - 08:50 |
|
Thank you for the level of detail on this, works exactly as written :) |
| Posted: Thu, 15.08.2013 - 10:55 |
|
In the next release of Workbooks, due out in late summer, you can build the same report by undertaking the following steps;
The resulting report should look something like the one below (click to enlarge).
|


.png "Click to enlarge")
- Log in to post comments