


In a SaaS (Software-as-a-Service) business, a key performance indicator is the cost of customer acquisition – how much does it cost to acquire each new customer?
Here at Workbooks we track all sorts of metrics: cost of leads, conversion metrics and marketing ROI to name just a few.
Let me share some interesting numbers: At present it costs us £248 to generate a qualified lead and we convert 1 in 10 of these into a sale. An average sale for us generates £5k of revenue in year one, so at present it costs around 50% of the year one revenue to acquire a new customer.
This blog post isn’t about the economics of our business, rather I wanted to use the information to highlight how you can use Workbooks to measure the effectiveness of your marketing activities.

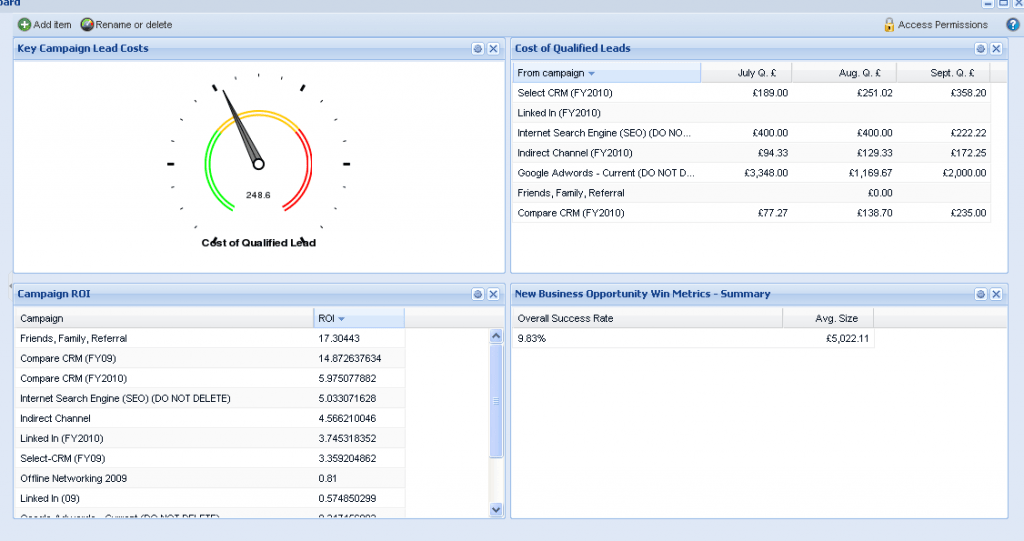
Above is a dashboard (created in Workbooks) that I use to measure these metrics. I have hidden some fields but you’ll get a pretty good view on what’s going on. Let me explain how we track this data.
The first stage of our sales process is to qualify a lead. Each month we get hundreds of leads into the business, these are mainly from people completing forms on our website (such as the free trial) or from other third-party websites that promote Workbooks.com. Some of these enquiries are people actively looking to purchase; many others are not prospective customers at all. Once we have spoken to the prospect and established their interest, they are either ‘qualified’ or ‘qualified-out’.
We use the Marketing Campaigns functionality of our product to track marketing expenditure on a monthly basis. So by writing a report which combines the total marketing costs and dividing that cost by the number of qualified leads generated, I can calculate a cost per qualified lead. In this case I have represented this as a dial chart.
In the top right chart you can see we track the cost of leads by campaign, monthly. This gives me some insight into which campaigns generate leads most cost effectively.
As you can see from my stats, our SEO (Search Engine Optimisation) is improving, but our Google Adwords campaigns are far too expensive! We will continue to run google Adwords for a few more months, to see if we can improve the results!
On the bottom left you can see the Campaign ROI report. This report takes information from Invoices in Workbooks and compares it to the marketing expenditure. It totals all invoices which are attributed to a specific campaign and divides the total sales by the marketing spend. As you can see our referral program delivered the best return on investment.
The final chart in the bottom right takes the total number of won opportunities as a percentage of the total number of deals – either won, lost or qualified out. This gives me our pipeline conversion metrics.
As you can see not all our marketing is effective, but the good news is I can actually tell which marketing is working and which isn’t! And of course this enables me to modify and ultimately improve the effectiveness of our marketing!