
- Welcome to the Knowledge Base
- Introduction
- Training
- Getting Started
- Preferences
- Activities
- Cases
- Forecasts & Quotas
- Importing Data
- Leads
-
Marketing
- Introduction to Marketing
- Marketing Campaigns
- Mailing Lists
- Products
- Mailshots
- Upload Library
- Templates
- Event Management
- Compliance Records
-
Spotler Integration
- What is Spotler?
- Navigating your Spotler homepage
- GatorMail
-
GatorLeads / Web Insights
- Tracking Code
- Setting up the Plugin
- Viewing Web Insights Data on your Form Layouts
- Domain Names and Online Activities
- Reporting incorrect Leads created through Web Insights
- Reporting on Web Insights data
- Using UTM Values
- Why aren’t Online Activities being created in the database?
- Why is GatorLeads recording online activities in a foreign language?
- GatorSurvey
- GatorWorkflow
- GatorPopup
- Opportunities
-
Integrations
- Mapping
- Electronic Signing Tools
- Creditsafe Integration
-
Zapier
- Introduction to Zapier
- Available Triggers and Actions
- Linking your Workbooks Account to Zapier
-
Setting up Zaps
- Posted Invoices to Xero Invoices
- Xero payments to Workbooks Tasks
- New Case to Google Drive folder
- New Case to Basecamp Project
- New Workbooks Case to JIRA Ticket
- Jira Issue to new Case
- 123FormBuilder Form Entry to Case
- Eventbrite Attendee to Sales Lead and Task
- Facebook Ad Leads to Sales Leads
- Wufoo Form Entry to Sales Lead
- Posted Credit Note to Task
- QuickBooks Online
- Survey Monkey responses to Tasks
- Multistep Zaps
-
Email Integrations
- Email Dropbox
- Workbooks Exchange Server Sync
- Workbooks Outlook Connector
- RevenueGrid Intelligence and Engage
-
Event & Webinar Integration Tools
- GoToWebinar
- ON24
- Microsoft Office
-
Outreach
- Installation
- Outreach Authentication
- Sync People to Outreach Prospects
- Sync Organisations to Outreach Accounts
- Sync Workbooks Opportunities to Outreach
- Sync Tasks/Activities from Workbooks to Outreach
- Sync Outreach Sequences to Workbooks
- Sync Outreach Sequence States to Workbooks
- Sync Outreach Sequence Step Numbers to Workbooks
- Sync Prospects/Accounts/Opportunities from Outreach to Workbooks
- Sync Outreach Tasks/Calls/Meetings to Workbooks
- Scribe/Workbooks Connector
- RingCentral
- Auditing
- Comments
- People & Organisations
- Projects
-
Reporting
- Introduction to Reporting
- Using Reports
- Charts
- Exporting Reports
- Advanced Reporting
- Report Snapshots
- Dashboards
-
Transaction Documents
-
Introduction to Transaction Documents
- Displaying & Adding Transaction Documents
- Copying Transaction Documents
- Transaction Documents Fields Help
- Transaction Documents Line Items Help
- Printing & Sending Transaction Documents
- Managing Transaction Document Currencies
- Managing Transaction Document Statuses
- Setting a Blank Default Currency on Transaction Documents
- Credit Notes
- Customer Orders
- Invoices
- Quotations
- Supplier Orders
- Contract Management
- Sagelink
-
Introduction to Transaction Documents
- Auditing
-
Configuration
- Introduction to System Administration
- Users & Security
- Preferences
- Database
- Accounting
- Email & Integration
-
Customisation
- Creating & Modifying Picklists
- Theme
-
Record Types
- Creating Custom Fields
- Report-based Custom Fields
- Linked Fields & Reference Fields
- Record Templates
- Form Layouts
- Customising relationships between parties
- Opportunity Stages
- Custom Records
- Automation
- PDF Configuration
- Contact Support
- Releases & Roadmap
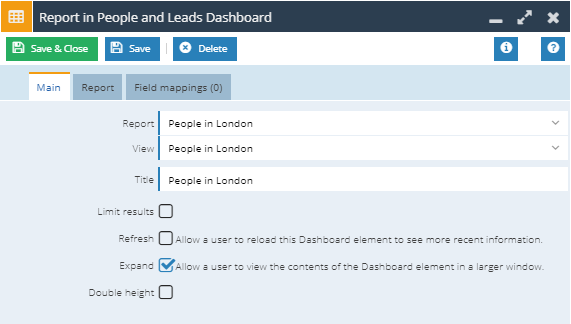
Configuring Dashboard Elements
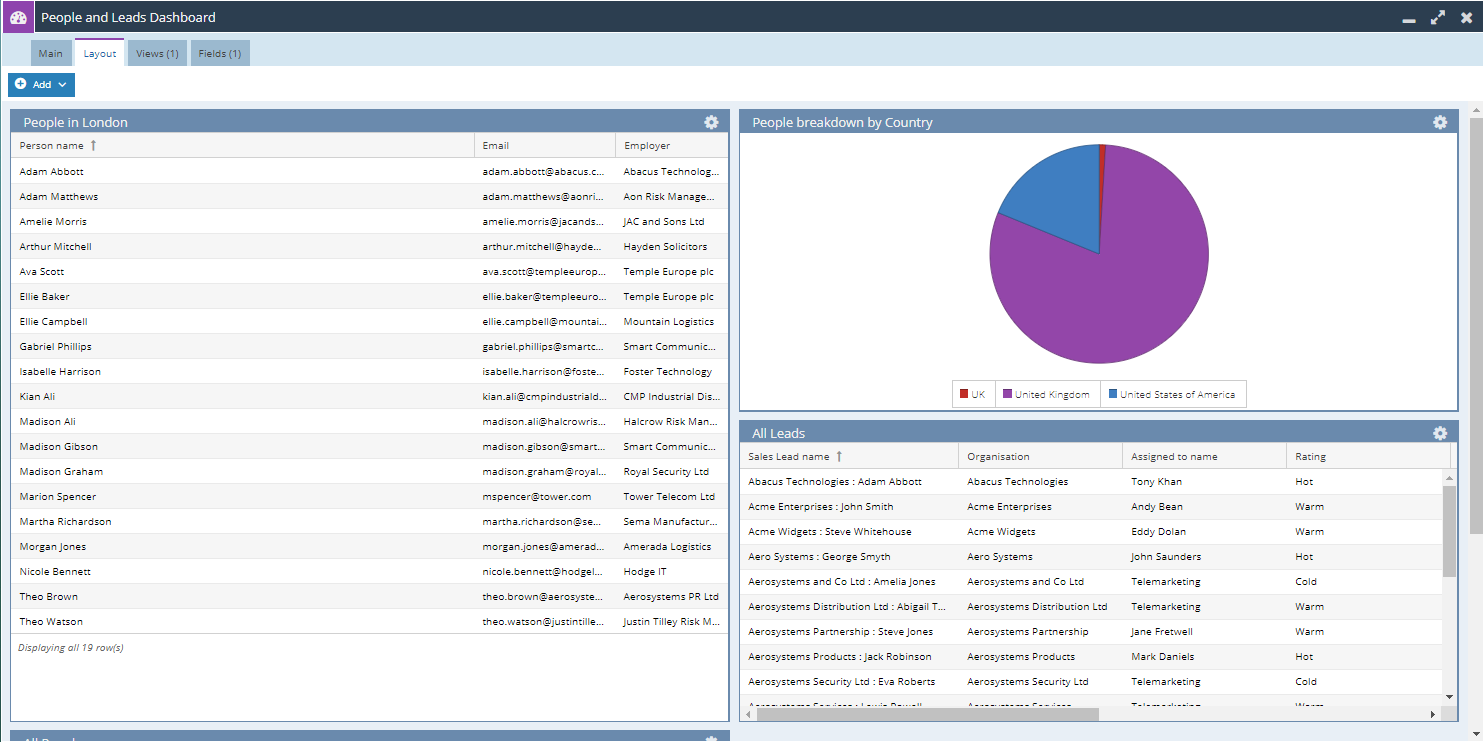
Once you have added a Dashboard Element it is possible to configure various settings on each Element to further control the look and feel as well as the access that Users have to data in the Dashboard.
Double Height
This setting is found on all Types of Dashboard Elements. Enabling the Double height setting amends the element so that it is twice the height of a standard Dashboard Element.
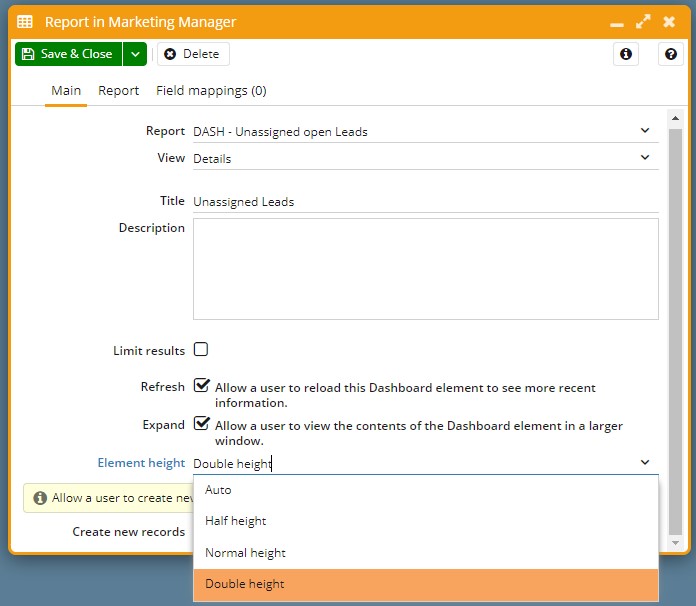
This may be especially useful for Reports that have a large number of Rows as it will reduce the need for scrolling through the Report and allow you to see all of the data in one place.
Note: This will not affect the Width of the Element.
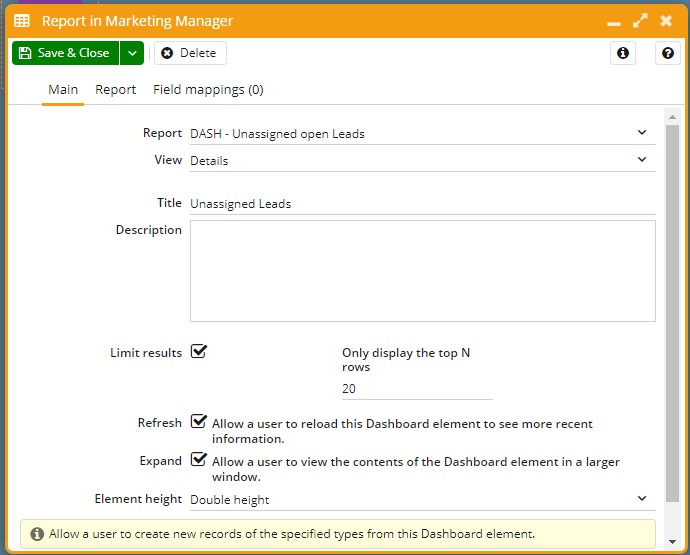
Limit Results
This setting is only found on Chart and Report Dashboard Elements. This setting allows you to configure how many rows within the Report are generated based on sorting order of the columns in the Report.
When creating a Report Element the default View for Users is to see the number of Rows specified in the List section of their Preferences. Limiting the Results means that all Users will see the same number of rows within the Report regardless of their Preferences.
For example if a User has their List Preference setting at 20, they will see an additional row at the bottom of the Report Element informing them that it is displaying the first 20 rows.
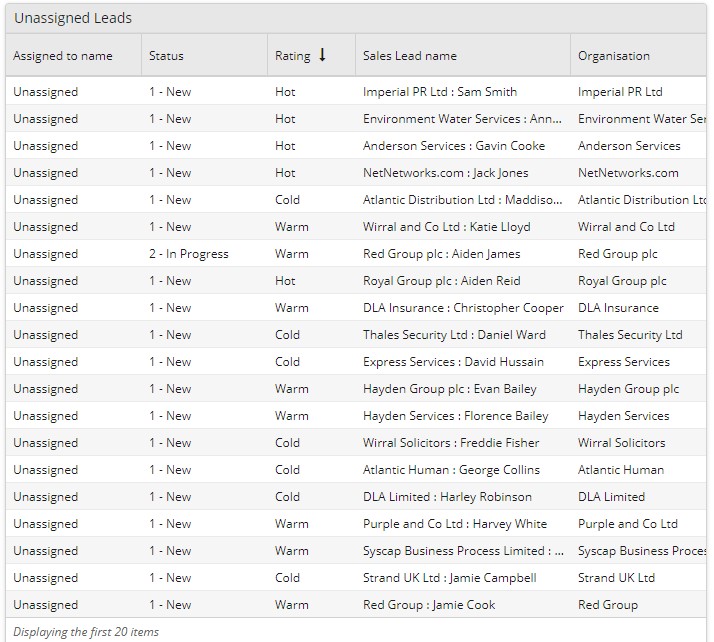
If the Limit Results setting is then applied to limit the results to 10 rows, when the Element is saved all Users will see the message at the bottom of the Report informing them that it is Displaying the first 10 rows of the Report.
Refresh
This setting is available for all Dashboard Element types. The Refresh setting allows any user with access to the Dashboard to refresh the element within the Dashboard, allowing each Element to be refreshed individually means that you do not need to reload an entire Dashboard to see the most up to date information for a specific Element.
This is especially beneficial if you have a Dashboard with a number of complex Reports being ran within it.
If the Refresh setting is selected Users will see a refresh icon (two arrows in a circle) along the Title banner which can be used at any time by a User.
![]()
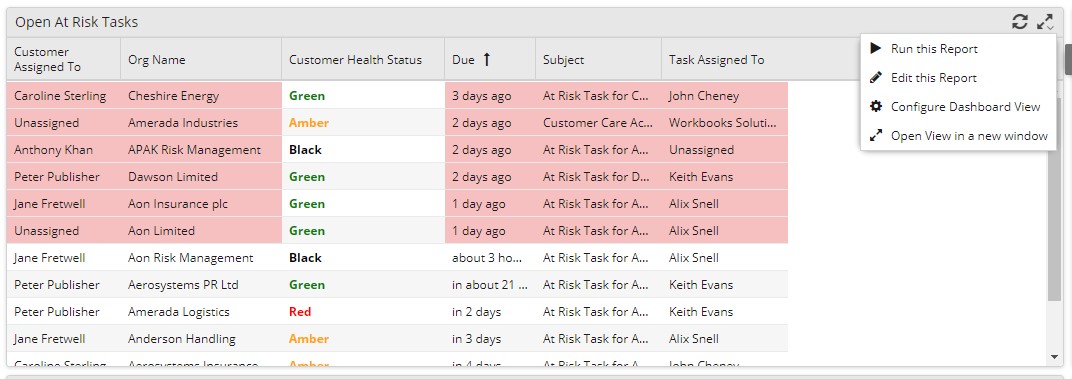
Expand
This setting is available for all Dashboard Element types. The Expand setting allows a specific Element to be opened in its own Window. From this Window you are able to access a Report that is generating a Report or Chart Element, perform Bulk Actions, apply filters or export the data.
If the Expand setting is selected Users will see an expand icon (two arrows pointing diagonally) along the Title banner which can be used at any time by a User.
In Dashboard reports, you have the option to Run the Report, Edit the Report, Configure the Dashboard View or Open the View in a new window via this expand icon.
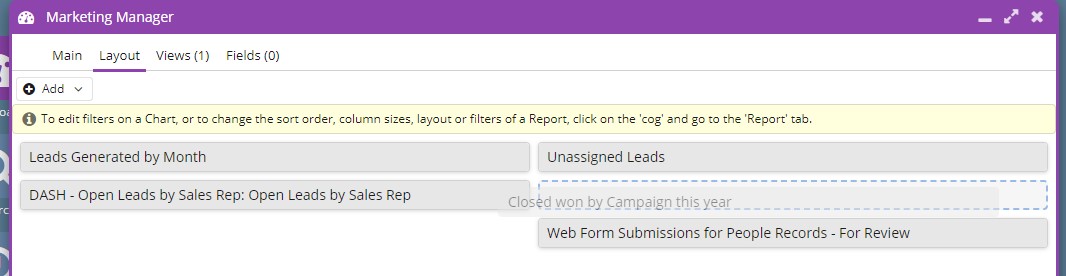
Moving Elements
Elements can be moved throughout the Dashboard by dragging and dropping them into place, this allows you to customise the order in which elements are displayed within the Dashboard when loaded by Users.
To Drag and Drop an element you will need to mouseover the Title Banner, this will change your cursor to a four-way arrow. This element can now be dragged to a new column or above or below other elements within the Dashboard.
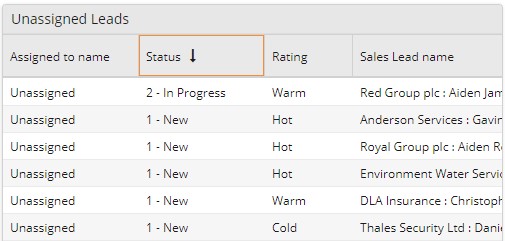
Reordering Columns and Sort Order within Report Elements
Once the Dashboard has been Ran Users are able to make changes to how the information is presented in a Report Element.
By default when a User runs a Report the Columns will be ordered and sorted for all Users as it was when editing the Dashboard.
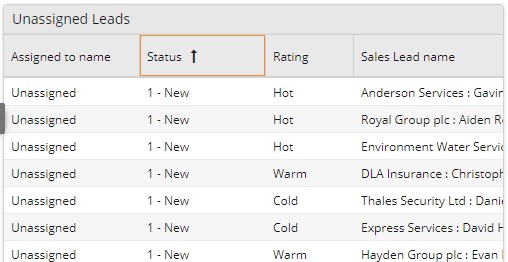
Users are then able to reorder the columns as needed and change the sort order of columns. This will only affect their instance of Workbooks and be saved automatically so when returning to the Dashboard in the future any changes made will be kept.
NOTE: Reports on Dashboards can also be configured to show as Cards. Please see the Knowledge Base article here to find out more.