
- Welcome to the Knowledge Base
- Introduction
- Training
- Getting Started
- Preferences
- Activities
- Cases
- Forecasts & Quotas
- Importing Data
- Leads
-
Marketing
- Introduction to Marketing
- Marketing Campaigns
- Mailing Lists
- Products
- Mailshots
- Upload Library
- Templates
- Event Management
- Compliance Records
-
Spotler Integration
- What is Spotler?
- Navigating your Spotler homepage
- GatorMail
-
GatorLeads / Web Insights
- Tracking Code
- Setting up the Plugin
- Viewing Web Insights Data on your Form Layouts
- Domain Names and Online Activities
- Reporting incorrect Leads created through Web Insights
- Reporting on Web Insights data
- Using UTM Values
- Why aren’t Online Activities being created in the database?
- Why is GatorLeads recording online activities in a foreign language?
- GatorSurvey
- GatorWorkflow
- GatorPopup
- Opportunities
-
Integrations
- Mapping
- Electronic Signing Tools
- Creditsafe Integration
-
Zapier
- Introduction to Zapier
- Available Triggers and Actions
- Linking your Workbooks Account to Zapier
-
Setting up Zaps
- Posted Invoices to Xero Invoices
- Xero payments to Workbooks Tasks
- New Case to Google Drive folder
- New Case to Basecamp Project
- New Workbooks Case to JIRA Ticket
- Jira Issue to new Case
- 123FormBuilder Form Entry to Case
- Eventbrite Attendee to Sales Lead and Task
- Facebook Ad Leads to Sales Leads
- Wufoo Form Entry to Sales Lead
- Posted Credit Note to Task
- QuickBooks Online
- Survey Monkey responses to Tasks
- Multistep Zaps
-
Email Integrations
- Email Dropbox
- Workbooks Exchange Server Sync
- Workbooks Outlook Connector
- RevenueGrid Intelligence and Engage
-
Event & Webinar Integration Tools
- GoToWebinar
- ON24
- Microsoft Office
-
Outreach
- Installation
- Outreach Authentication
- Sync People to Outreach Prospects
- Sync Organisations to Outreach Accounts
- Sync Workbooks Opportunities to Outreach
- Sync Tasks/Activities from Workbooks to Outreach
- Sync Outreach Sequences to Workbooks
- Sync Outreach Sequence States to Workbooks
- Sync Outreach Sequence Step Numbers to Workbooks
- Sync Prospects/Accounts/Opportunities from Outreach to Workbooks
- Sync Outreach Tasks/Calls/Meetings to Workbooks
- Scribe/Workbooks Connector
- RingCentral
- Auditing
- Comments
- People & Organisations
- Projects
-
Reporting
- Introduction to Reporting
- Using Reports
- Charts
- Exporting Reports
- Advanced Reporting
- Report Snapshots
- Dashboards
-
Transaction Documents
-
Introduction to Transaction Documents
- Displaying & Adding Transaction Documents
- Copying Transaction Documents
- Transaction Documents Fields Help
- Transaction Documents Line Items Help
- Printing & Sending Transaction Documents
- Managing Transaction Document Currencies
- Managing Transaction Document Statuses
- Setting a Blank Default Currency on Transaction Documents
- Credit Notes
- Customer Orders
- Invoices
- Quotations
- Supplier Orders
- Contract Management
- Sagelink
-
Introduction to Transaction Documents
- Auditing
-
Configuration
- Introduction to System Administration
- Users & Security
- Preferences
- Database
- Accounting
- Email & Integration
-
Customisation
- Creating & Modifying Picklists
- Theme
-
Record Types
- Creating Custom Fields
- Report-based Custom Fields
- Linked Fields & Reference Fields
- Record Templates
- Form Layouts
- Customising relationships between parties
- Opportunity Stages
- Custom Records
- Automation
- PDF Configuration
- Contact Support
- Releases & Roadmap
Introduction to Dashboards
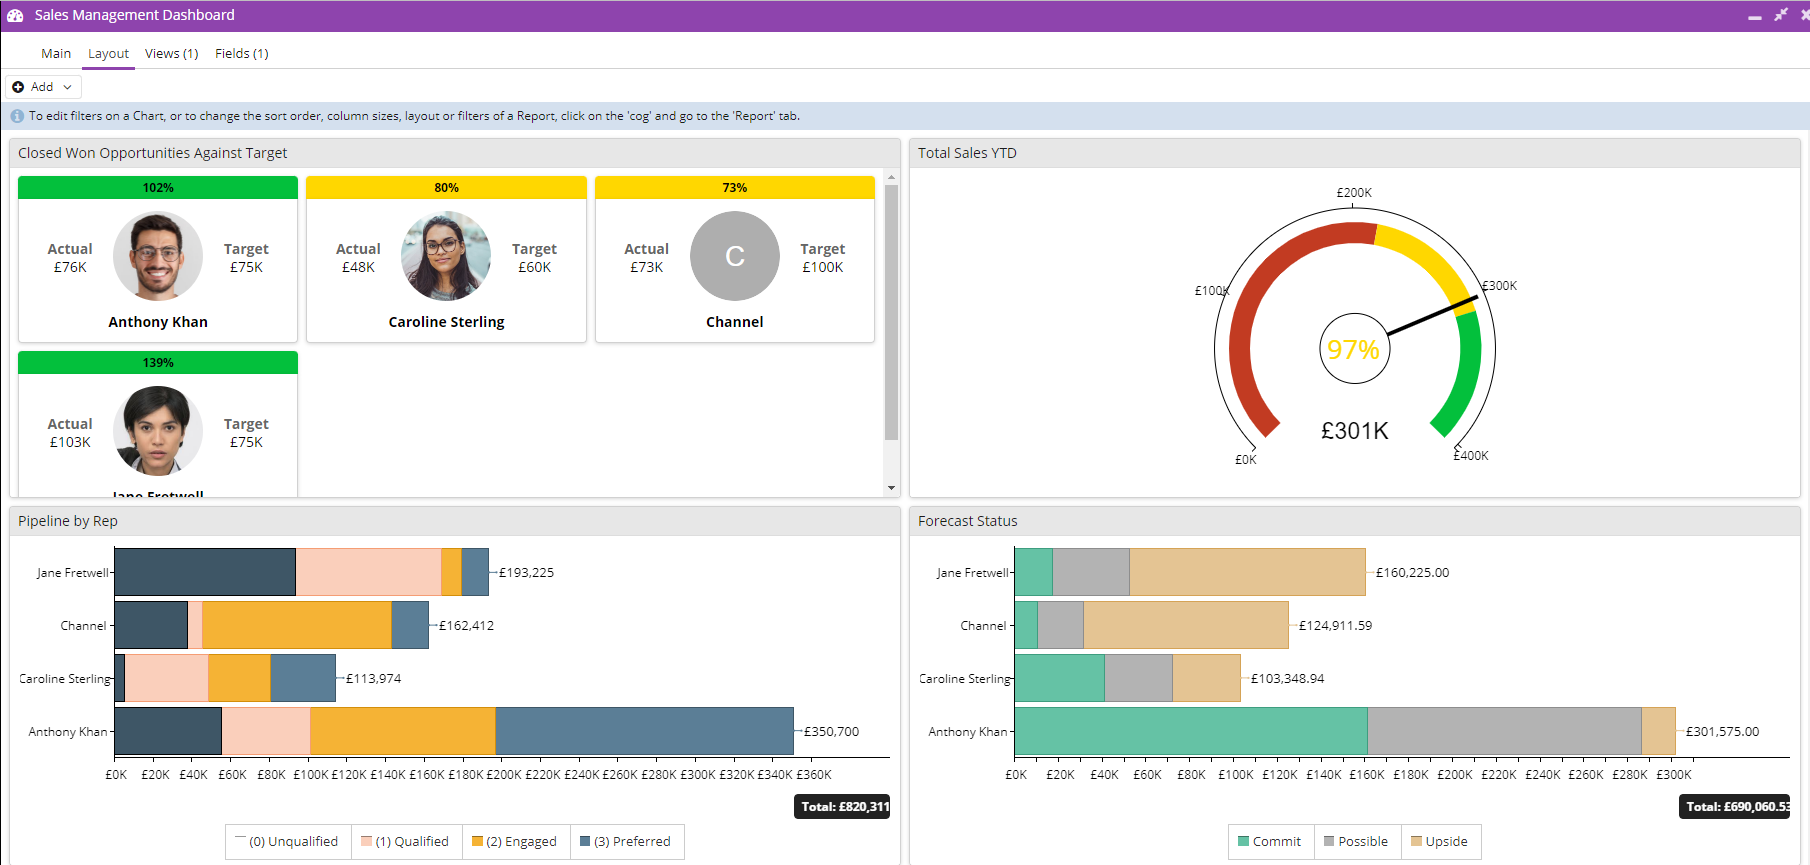
Dashboards offer you a real-time, holistic view of your business; they can show you selected reports, charts or other elements in an easy to read and understandable format.
A Dashboard can display a number of different items allowing you to gain complete visibility of specific business areas with ease. Examples of how Dashboards can be used include: pipeline management, case handling, or tracking the financial health of your business.
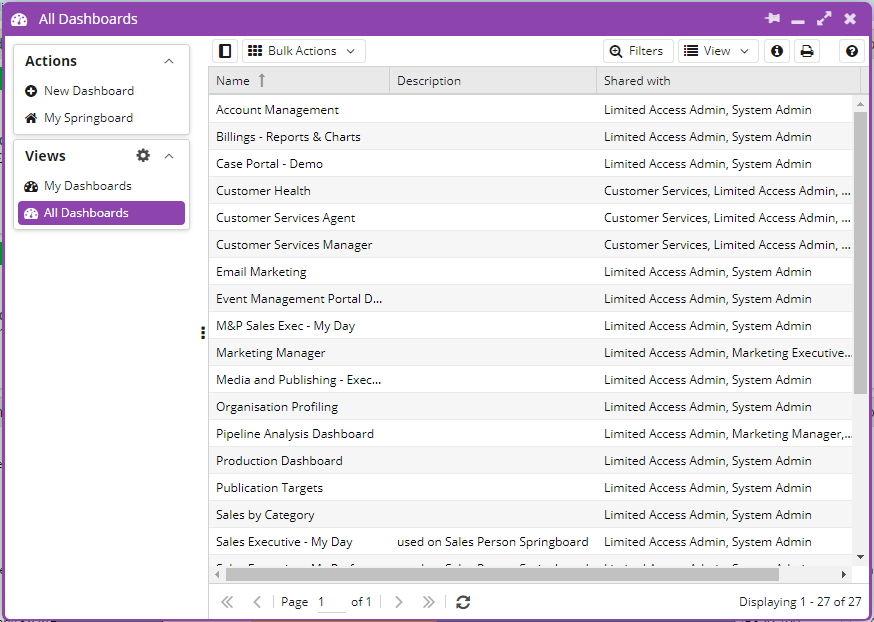
Dashboards can be created or modified from the Dashboard Menu, which is found from Start > Dashboards, or from the Start Menu, Start > New > Dashboard. A new Dashboard can then be added using the New Dashboard Button, and existing Dashboards can be reviewed from the All Dashboards or My Dashboards Views accordingly.
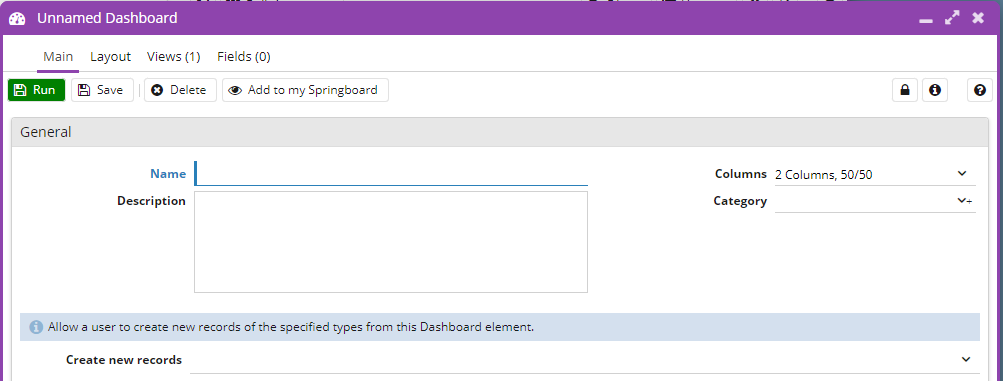
Using New Dashboard will open a new a window which allows you to add a Name, Description, Category, and decide the column layout of the Dashboard. This includes the number of Columns in the Dashboard as well as the ratio of space each column uses. These can be changed at a later date if you decide you want to rename your Dashboard or change the layout of the Columns.
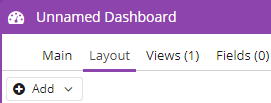
Once you have set this up, you can start adding elements to the Dashboard. These are added from the Layout Tab, using the Add Button.
There are five different types of elements that can be added to a Dashboard:
- Charts: Charts provide a pictographic output of a specific Report View, these can be further filtered or amended as required once added to the dashboard.
- Reports: Report Views can be added to the Dashboard so that results from a number of different reports can be easily referred to in one place.
- Landing page views: Landing page views give you quick, lightweight insights into your data.
- Web Pages: Specific Web Pages that may provide regular updates, such as an overview of the service status can be added to the Dashboard.
- Web Processes: A Web Process, such as a Case or Lead allocation Script, can be called directly from the Dashboard.
Check out this overview of the latest Dashboard and Reporting enhancements from 2022:
More information on Adding Dashboard Elements can be found on the Knowledge Base.
Dashboard menus are hidden by default. However, you can select this button to view:
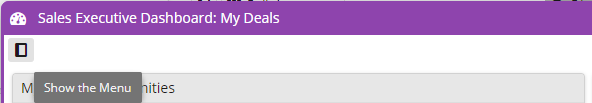
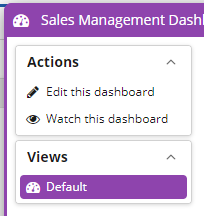
Alternatively, it can be viewed from the icon menu:
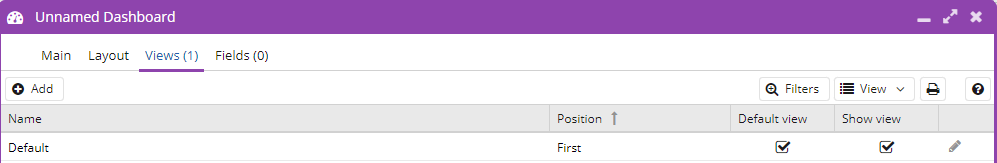
Views
When creating a Dashboard, a View called Default will be created automatically for you, this is where specific Filters and Field Mappings can be added. This allows you to create multiple views for different Users from the same Dashboard such as a View for different Sales Teams. Rather than creating a different Dashboard for each Team the same Dashboard can be used with a different View applied.
More information on the configuration of Views can be found on our Adding Views to Dashboards Knowledge Base page.
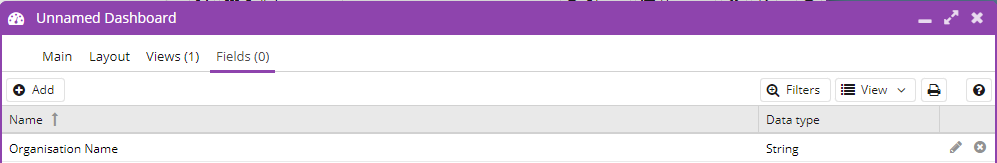
Fields
The Fields tab allows you to set up Filters over a number of different Dashboard windows, these can be applied to any of the Views setup on the Dashboard as needed.
We have more information and examples of Field Mappings and filters on our Knowledge Base page, Dashboard Fields.
Dashboards with multiple columns will automatically display a single column when you resize them.