- Welcome to the Knowledge Base
- Introduction
- Training
- Getting Started
- Preferences
- Activities
- Cases
- Forecasts & Quotas
- Importing Data
- Leads
-
Marketing
- Introduction to Marketing
- Marketing Campaigns
- Mailing Lists
- Products
- Mailshots
- Upload Library
- Templates
- Event Management
- Compliance Records
-
Spotler Integration
- What is Spotler?
- Navigating your Spotler homepage
- GatorMail
-
GatorLeads / Web Insights
- Tracking Code
- Setting up the Plugin
- Viewing Web Insights Data on your Form Layouts
- Domain Names and Online Activities
- Reporting incorrect Leads created through Web Insights
- Reporting on Web Insights data
- Using UTM Values
- Why aren’t Online Activities being created in the database?
- Why is GatorLeads recording online activities in a foreign language?
- GatorSurvey
- GatorWorkflow
- GatorPopup
- Opportunities
-
Integrations
- Mapping
- Electronic Signing Tools
- Creditsafe Integration
-
Zapier
- Introduction to Zapier
- Available Triggers and Actions
- Linking your Workbooks Account to Zapier
-
Setting up Zaps
- Posted Invoices to Xero Invoices
- Xero payments to Workbooks Tasks
- New Case to Google Drive folder
- New Case to Basecamp Project
- New Workbooks Case to JIRA Ticket
- Jira Issue to new Case
- 123FormBuilder Form Entry to Case
- Eventbrite Attendee to Sales Lead and Task
- Facebook Ad Leads to Sales Leads
- Wufoo Form Entry to Sales Lead
- Posted Credit Note to Task
- QuickBooks Online
- Survey Monkey responses to Tasks
- Multistep Zaps
-
Email Integrations
- Email Dropbox
- Workbooks Exchange Server Sync
- Workbooks Outlook Connector
- RevenueGrid Intelligence and Engage
-
Event & Webinar Integration Tools
- GoToWebinar
- ON24
- Microsoft Office
-
Outreach
- Installation
- Outreach Authentication
- Sync People to Outreach Prospects
- Sync Organisations to Outreach Accounts
- Sync Workbooks Opportunities to Outreach
- Sync Tasks/Activities from Workbooks to Outreach
- Sync Outreach Sequences to Workbooks
- Sync Outreach Sequence States to Workbooks
- Sync Outreach Sequence Step Numbers to Workbooks
- Sync Prospects/Accounts/Opportunities from Outreach to Workbooks
- Sync Outreach Tasks/Calls/Meetings to Workbooks
- Scribe/Workbooks Connector
- RingCentral
- Auditing
- Comments
- People & Organisations
- Projects
-
Reporting
- Introduction to Reporting
- Using Reports
- Charts
- Exporting Reports
- Advanced Reporting
- Report Snapshots
- Dashboards
-
Transaction Documents
-
Introduction to Transaction Documents
- Displaying & Adding Transaction Documents
- Copying Transaction Documents
- Transaction Documents Fields Help
- Transaction Documents Line Items Help
- Printing & Sending Transaction Documents
- Managing Transaction Document Currencies
- Managing Transaction Document Statuses
- Setting a Blank Default Currency on Transaction Documents
- Credit Notes
- Customer Orders
- Invoices
- Quotations
- Supplier Orders
- Contract Management
- Sagelink
-
Introduction to Transaction Documents
- Auditing
-
Configuration
- Introduction to System Administration
- Users & Security
- Preferences
- Database
- Accounting
- Email & Integration
-
Customisation
- Creating & Modifying Picklists
- Theme
-
Record Types
- Creating Custom Fields
- Report-based Custom Fields
- Linked Fields & Reference Fields
- Record Templates
- Form Layouts
- Customising relationships between parties
- Opportunity Stages
- Custom Records
- Automation
- PDF Configuration
- Contact Support
- Releases & Roadmap
Adding Targets, Conditional Formatting and CSS Styling
This page runs through how you can customise your reports further by adding:
Adding Targets to Summarised Columns
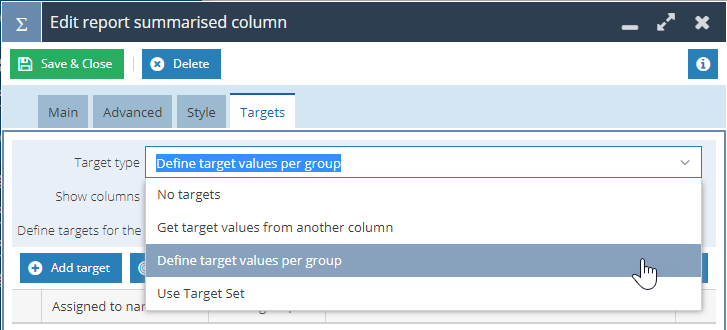
In reporting, you can set targets for certain records by clicking on the Targets tab of a report column.
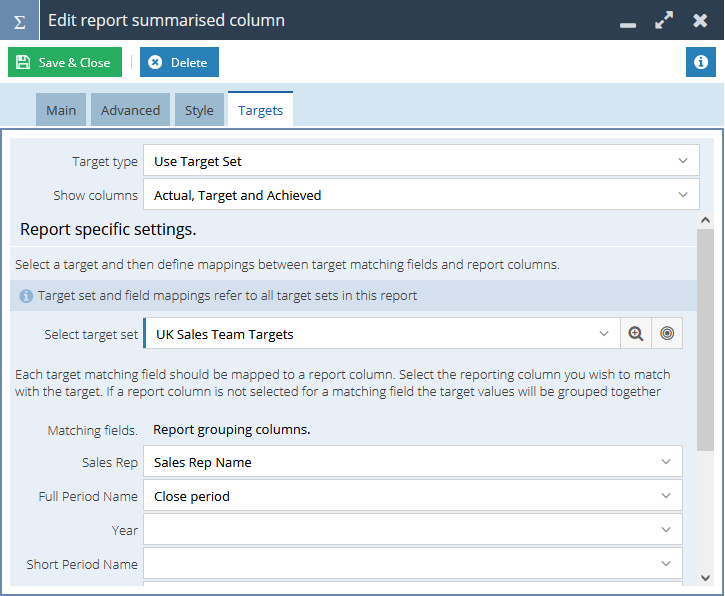
Here you can click Add target and reference the column you wish to set targets for; in the above example, we have set them against the person the records are assigned to.
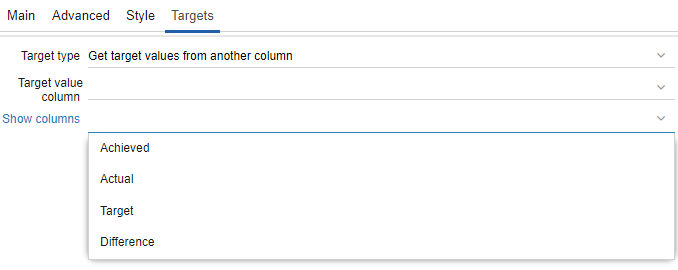
You can change the way in which you want the data to be calculated and displayed within the report view using the multiselect picklist shown below.
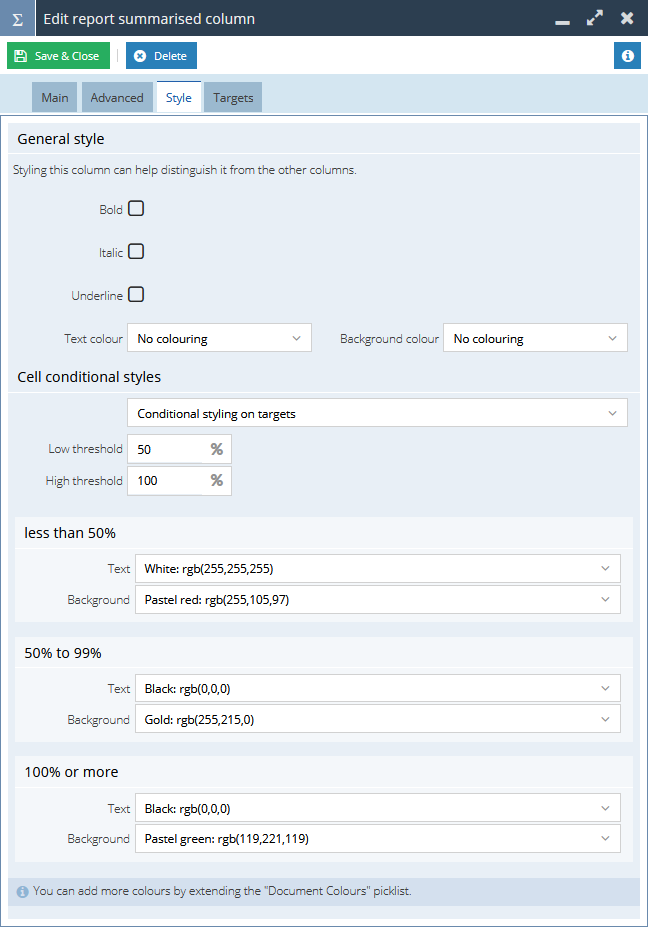
Conditional Formatting
In reports, we can use a Conditional formatting function to add colour to our reports and enhance the visual experience of them.
In the case below, we are setting targets for 4 of our Support Team members, assessing how many cases they have resolved over the last 2 months, these values will then dictate the colour formatting of their resulting cells
With the targets set, we can then select the styling that we would like to be applied to the cells by defining thresholds - The upper and lower thresholds can be set as percentages by the user, and colour styling can be applied to these ranges accordingly.
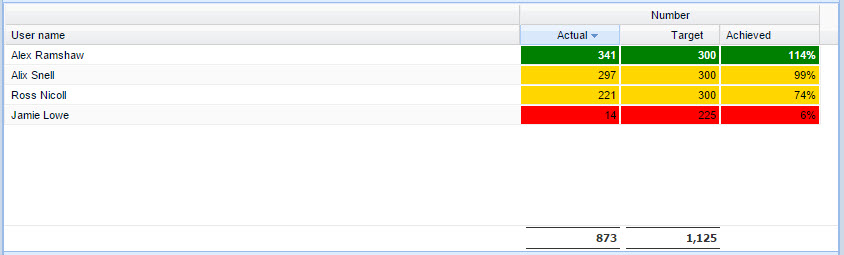
Using the styling and target configuration above would result in a report that gives the following sort of output - using colours to give a clear indication of performance using the "Traffic Light" or RAG system.
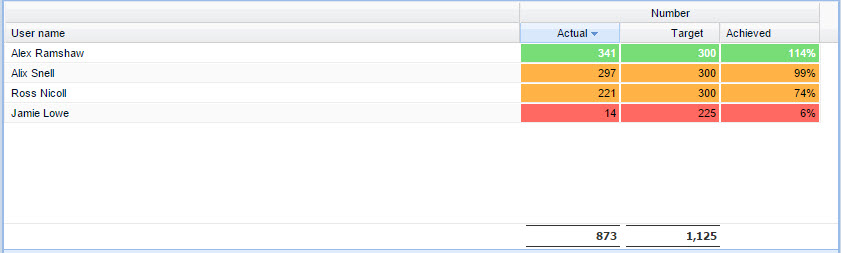
You are also able to change the colours into softer "Pastel" colouring by selecting different colour codes:
You can achieve even more detailed styling options by using CSS styling, which is can provide you with endless formatting options for your reports
CSS Styling
If the user wants more thresholds or more complex criteria, or to use more advanced CSS styling, they can use the 'calculated styling' option.
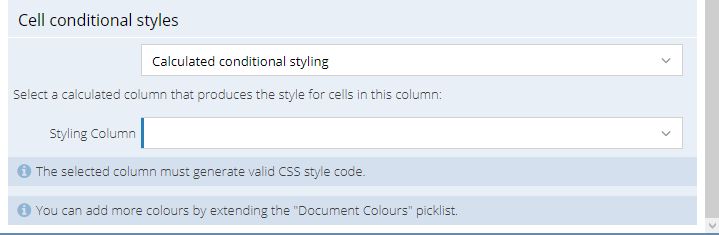
Using the CSS styling option gives the user a lot more flexibility you are no longer bound by 3 target thresholds, specific colours, and specific conditions. CSS styled columns must be set up through calculated columns to provide valid CSS code.
The opportunities for customisation of reports using CSS styling are endless for more information on CSS code, please refer here
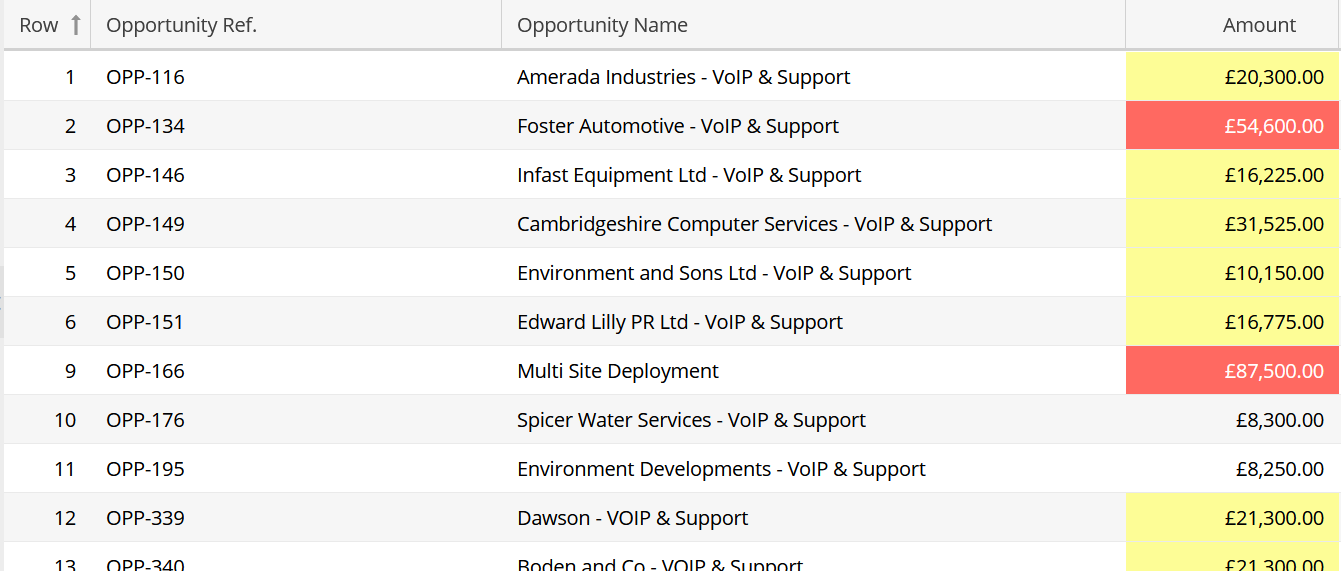
One simple way that you can use CSS styling in reports is when looking at Account Health - Obviously, we cannot set targets based on strings of text, so CSS styling is extremely useful in these scenarios - Please see the screenshot below as an example
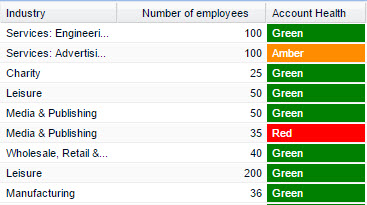
The CSS code that dictates what colour to fill the cell based on the wording is held in a separate column - this can be hidden from the report view, so that it does not make your reports look messy
If you wanted to achieve the sort of visual CSS styling "traffic light" system shown above, then this is the sort of CSS code you would need
CASE party_organisation.cf_organisation_health_check
WHEN 'Red'     THEN 'background-color: red; color: White'
WHEN 'Amber'   THEN 'background-color: DarkOrange; color: White'
WHEN 'Green'   THEN 'background-color: green; color: White'
WHEN 'Black'   THEN 'background-color: black; color: White'
ELSE 'background-color: white; color: Black'
END
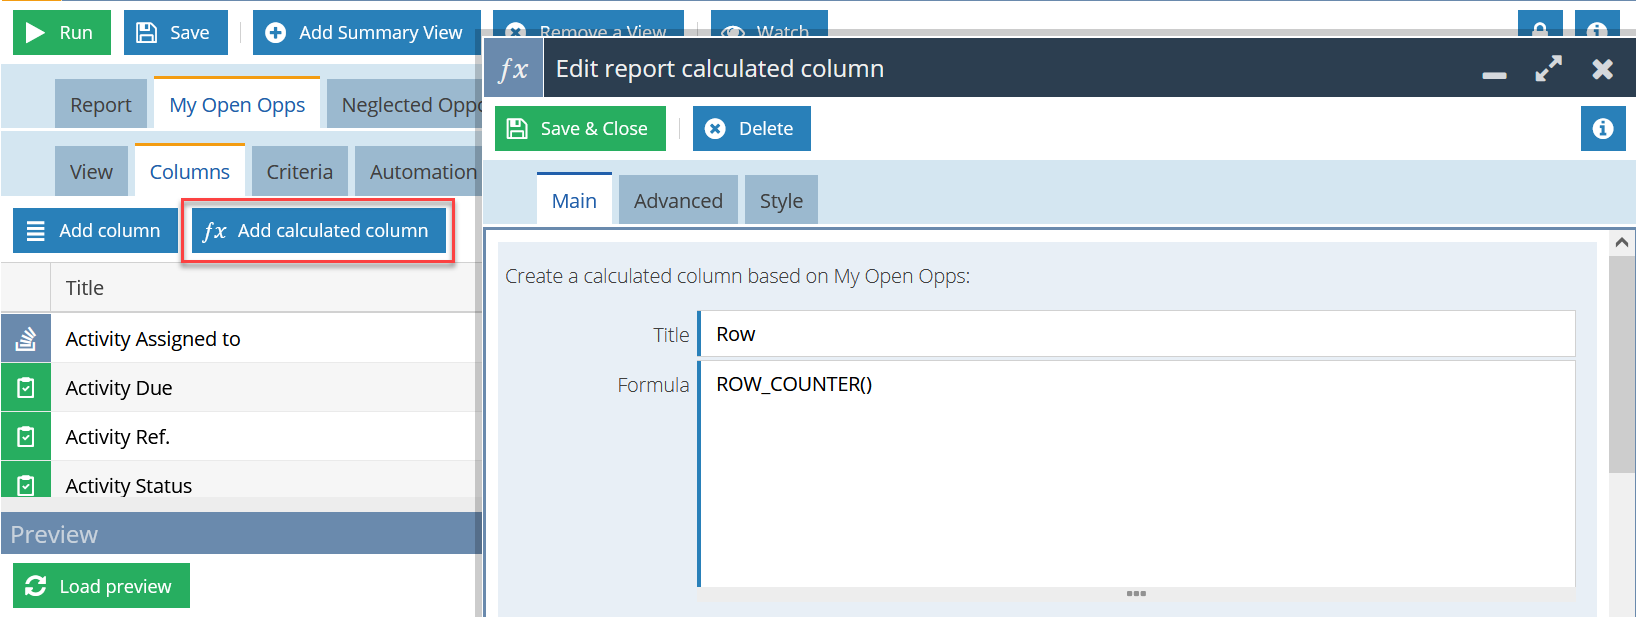
Row Numbers
Depending on what you're trying to achieve, it might make sense to include a row number next to each line of data. This can be done easily using the ROW_COUNTER() function, simply add a Calculated Column and type the code ROW_COUNTER(), or navigate to Reporting functions > ROW_COUNTER in the function builder.
The result will be a grid that looks something like this: