


Creating a Blank Report
How to create a report using the option ‘Create a blank report’, including adding columns and summary views.
![]()
After selecting Create a new blank report, you will see the full list of ‘object types’ (i.e. types of record) that you can report on. It is important to consider what type of record you want to start building your report from.
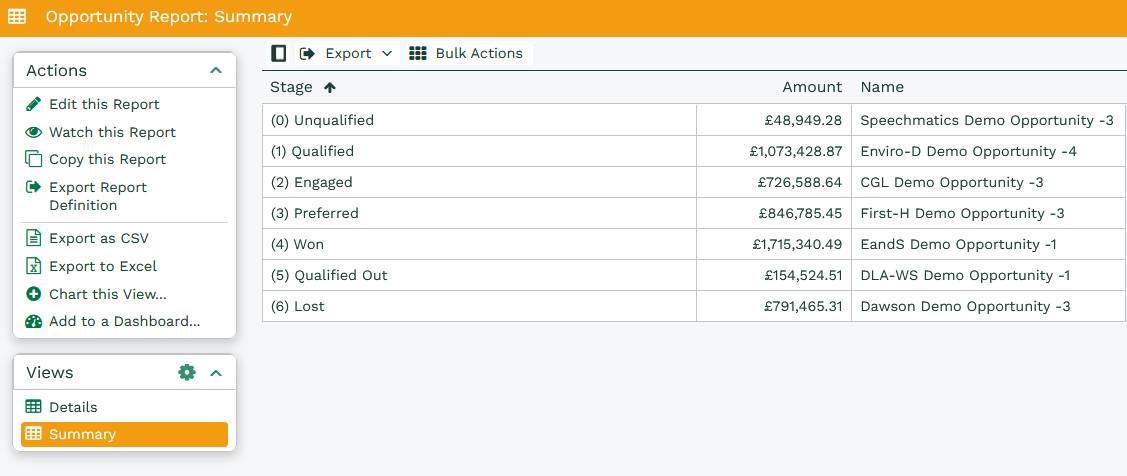
Below is an example of creating an Opportunity Report showing the total value of all open Opportunities on your database, summarised by the stage the Opportunity has reached. This an example of the sort of report we might be aiming for:
Click Start > New > Report > Create a new blank report.
Tip
Click on “Refresh preview” each time you add a column, criteria or summarise your data.
This enables you to check your report is building correctly and ‘sense-check’ that it’s displaying the results in the way you require.
Add columns
In the Columns tab click Add column from Opportunities. Click on the arrow next to Column to display a list of all the fields you can choose to add to your Report.
From the list choose Opportunity name > Save & Close. To add new columns, click on Add column from Opportunities again and use the arrow next to Column to choose the field(s) you want to display. You can also type ahead to search for a column. This does a ‘contains’ search, so if you are looking for ‘start date’ you could just type ‘date’ and it would show you any columns with ‘date’ in it. Repeat this process until you have all the columns you need.
For this example, add columns for Amount and Opportunity stage. If you want to see what data your Report will show as you build the Report, click on Refresh preview in the lower half of the record after you add each column.
NOTE: Some of the column options have a small black arrow next to them ![]()
These are known as ‘breadcrumbs’ and enable you to ‘drill through’ to another object (record) types and use the fields from different record types within your report.
Apply Criteria
You now have a Report of all Opportunities on your database. You can sort, reorder and filter this information as you would with any other grid in Workbooks. To refine the results to show only those that are open, click on Criteria > Add criteria from Opportunities. From the picklist, choose Opportunity stage. This will activate the Operator field. Click on the dropdown to see the operators you can apply. To see only open Opportunities select does not contain. In the next box that appears, specify the value(s), you want to apply. In this case, type in Closed (this would remove all those Opportunities that are either Closed Won or Closed Lost). Click Refresh preview to update the results displayed. Click Save & Close.
NOTE: You can apply an ‘or’ operator to criteria by using a comma. For example, if you want to find Opportunities that are either at Stage 1 or at Stage 2, you would enter in the Text box: Stage 1, Stage 2.
Summarise
You now have a Report that lists all the open Opportunities on your database, showing the amount attributed to each Opportunity as well as the Opportunity stage name for each one. To summarise the Report by what stage the Opportunity has reached, add a Summary view by clicking Add Summary View. Click “Add grouping column” and choose Amount (home currency), choose to group by stage towards the bottom of this page, then click Save & Close.
Click Refresh preview. Now the Report shows the total value of Opportunities on your database summarised by Opportunity stage.
NOTE: Now that the Report has been summarised, there’s no need to display the Opportunity name column. You can remove it from the Report by clicking on the delete symbol next to Opportunity name in the Report builder window.
When your Report is complete click Save & Close. To open it again, click Start > Reporting > My Reports. Click on the hyperlink to open it. If you want to modify the Report further you can click on Edit this Report and make any changes you require.