Adding Elements to Dashboards
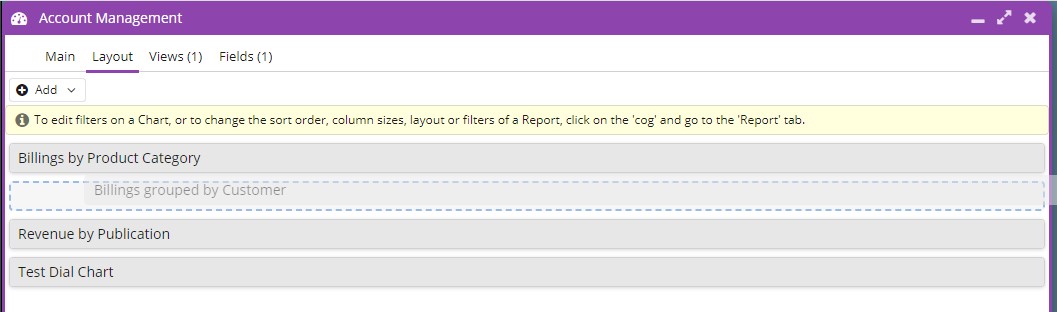
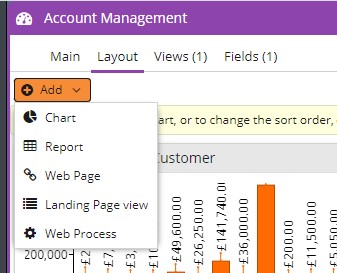
To add new elements (sometimes called ’tiles’) or amend existing ones open the Layout tab on the Dashboard. Elements can be Charts, Reports, Web Pages or Web Processes.
On the Layout tab, click Add and select the type of element you want to add from the picklist. By default, new elements will always appear in the top of the left hand column of the Dashboard but can be moved later.
Users given permissions to access a specific Dashboard will automatically see the Reports and Charts, even if they don’t have permission to access those individual Reports and Charts. However, they will not be able to drill into the elements for further analysis unless they have View Permissions for the Report being used.
You can choose exactly which height an element displays as using the Element Height dropdown. Auto will automatically determine the best size, but you can also pick from normal, double or half height, depending on how you want to display the data. Note: Auto will only work for grids, charts will not be resized. The number of rows of data is determined by preferences therefore if 100 lines are chosen, and there are more than 100 lines of data to be shown, auto will only fit 100 lines of data.
Adding a Chart to a Dashboard
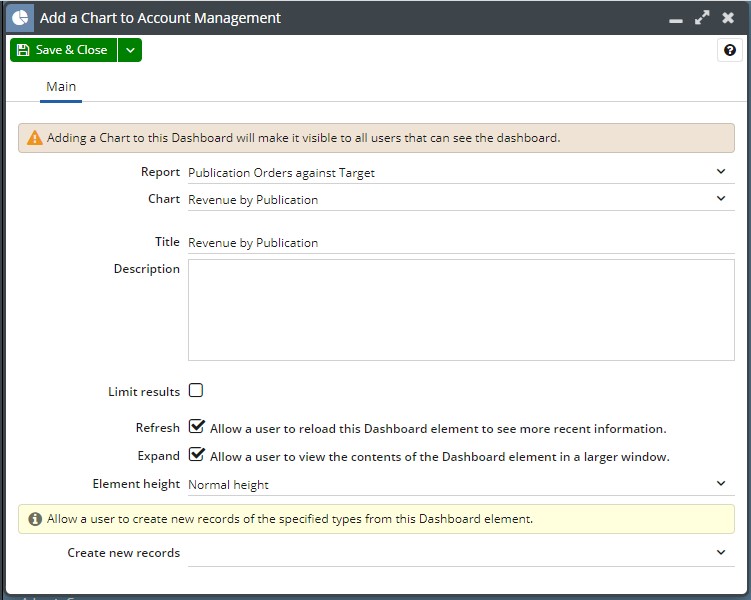
If you add a Chart to the Dashboard, this will open a new window where you will need to enter the details of where the Chart is found, as well as providing it with a Title. The Report picklist will be restricted to only show Reports that you have Permissions to View and that have at least one Chart. Once you have selected the Report, you will then be able to select the Chart from the Report that you want to appear in the Dashboard Element.
By default the Title given to the element will be the same as the Chart name, however this can be amended if required.
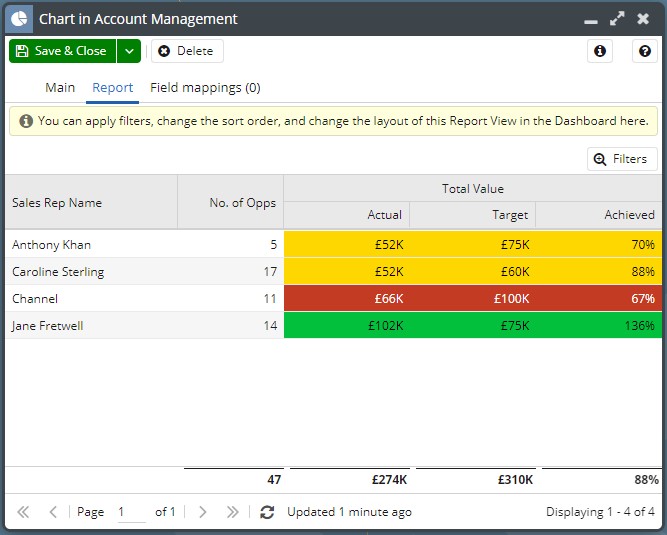
Once you have set up the Chart, click Save; this will create two new Tabs: Report and Field Mappings.
The ‘Report’ tab shows you the underlying report data used to generate the Chart.
From this Tab you can apply filters and change the sort order of columns; any changes made here will be applied to the Chart within the Dashboard. This means that the same Chart could be added to a Dashboard multiple times with different filters applied to display different information.
The ‘Field mappings’ tab allows you to review any existing Dashboard Field Mappings setup within the Dashboard as well as add a newly created Chart to a Dashboard Field.
Adding a Report to a Dashboard
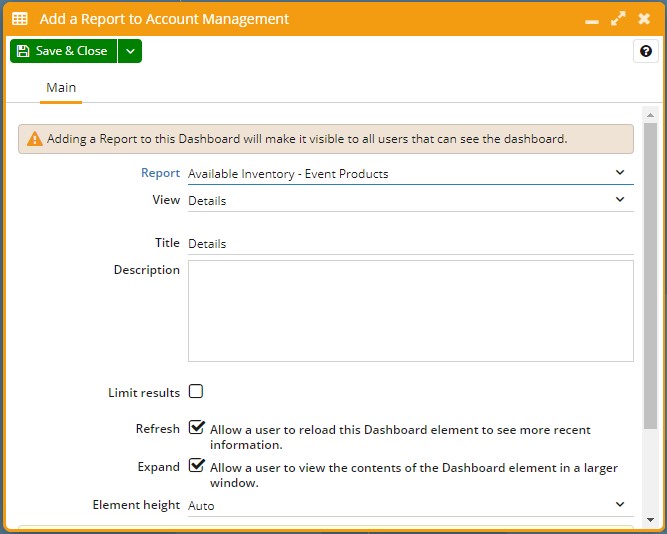
If you choose to add a Report to the Dashboard a new window will open, where you will need to enter the details of the Report View, as well as giving it a Title.
The Report picklist will be restricted to only show Reports that you have Permissions to View. Once you have selected the Report you will then be able to choose the View from the Report that you want to appear as the Dashboard Element.
By default, the Title given to the element will be the same as the View name, however, this can be amended if required.
Once you have set up the Report View, click Save; this will create two new Tabs, Report and Field Mappings.
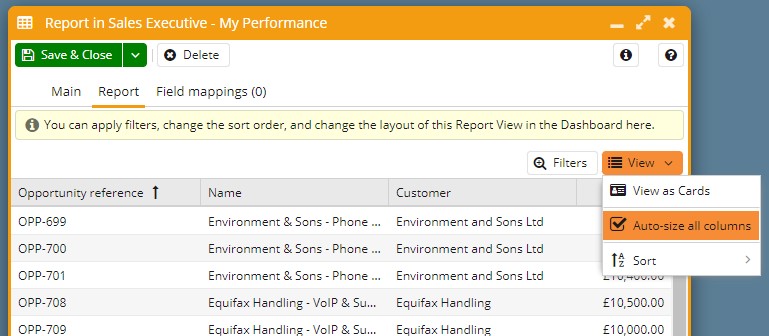
The ‘Report’ tab shows you the report data that will be shown in the Dashboard Element. From this tab, you are able to apply filters and change the sort order of columns; any changes made here will be applied to the Report View within the Dashboard. This means that the same Report could be added to a Dashboard multiple times with different filters applied to display different information.
By default, the columns will be auto-sized for any new report added to a Dashboard.
The ‘Field mappings’ tab allows you to review any existing Dashboard Field Mappings setup within the Dashboard as well as add a newly created Report View to a Dashboard Field.
Adding a Web Page to a Dashboard
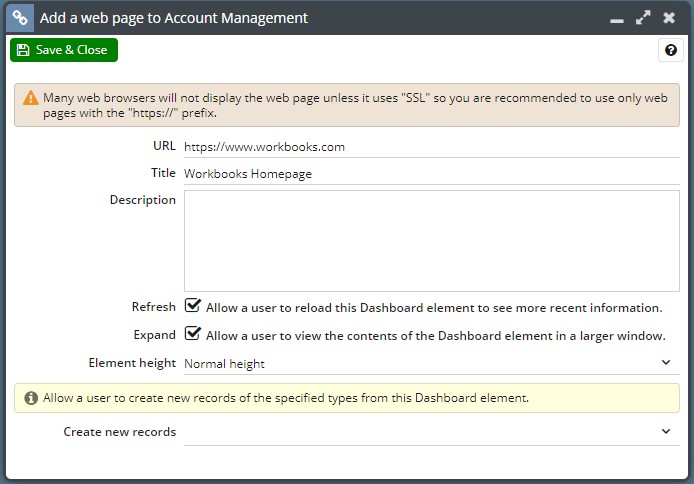
If you choose to add a Web Page to the Dashboard, a new window will open where you will need to enter the details of the Web Page. You do not need to enter the full domain, however it is recommended that any webpage added has the https:// URL prefix to increase the likelihood that Workbooks will be able to connect to it.
Once you have entered the URL you can then provide a Title for the Element; this will not be automatically populated and needs to be entered manually.
Adding a Web Process to a Dashboard
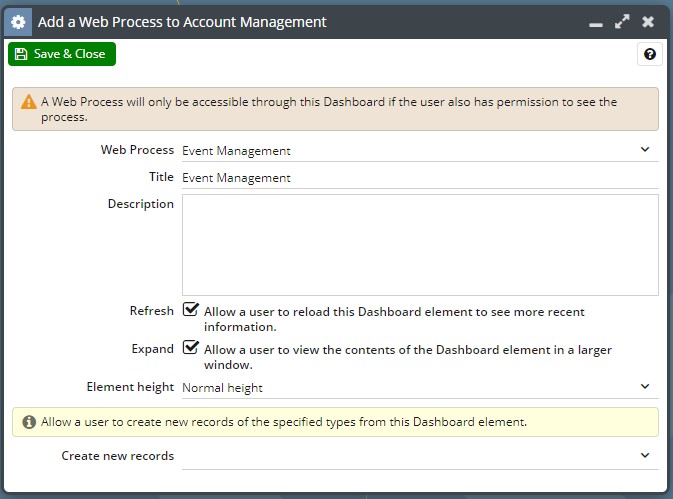
If you choose to add a Web Process to the Dashboard a new window will open where you will be able to select a Web Process from the picklist. You will only be able to see Web Processes that are shared with you. Once you have selected the Web Process, the Title will be automatically populated with the Web Process name, however this can be amended if needed.
Adding new records to a dashboard
When setting up your dashboard you can specify what record type you can create from it using the Create new records dropdown below.
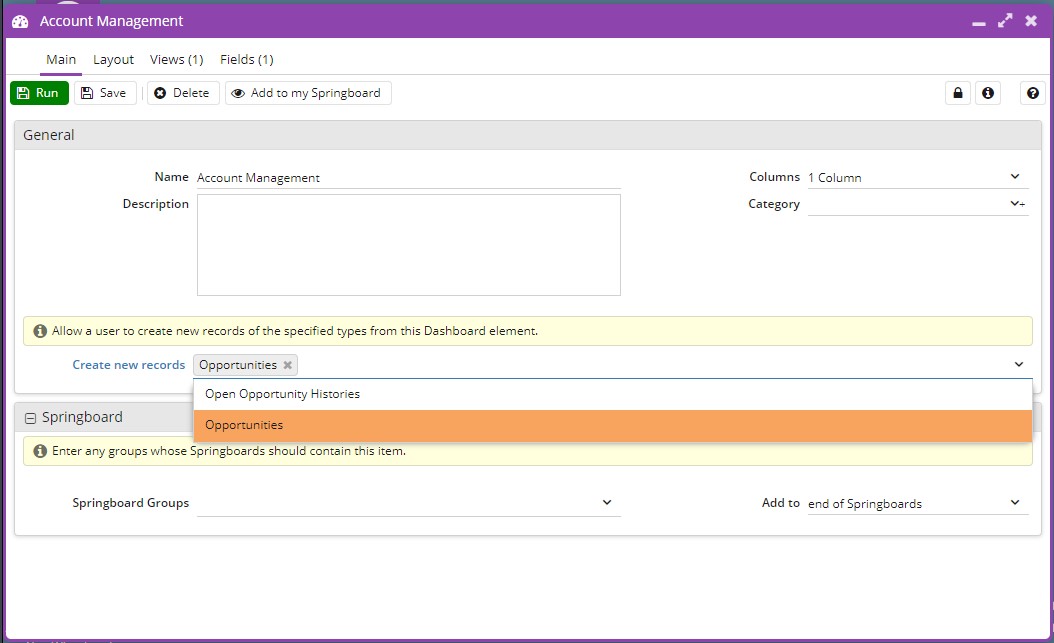
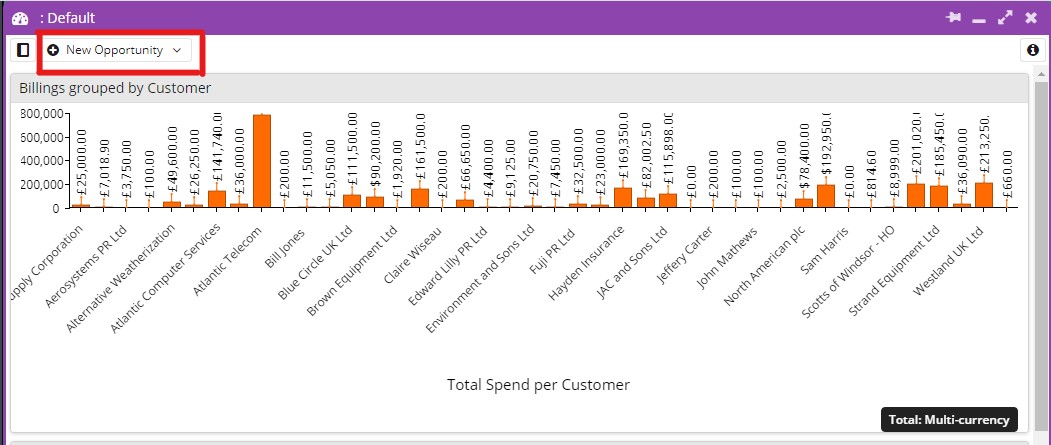
For instance, here you can create new opportunities from your sales dashboard.
To re-arrange elements on a dashboard, you can pick up an element, everything else will condense and then you can drag and drop it where you like.