Adding Targets, Conditional Formatting and CSS Styling
In Workbooks, you can enhance your Reports by using Targets, Conditional Formatting and CSS Styling to make the results in the Report stand out. This allows Users to interpret Report data more easily and quickly identify trends or exceptions.
This page runs through how you can customise your reports further by adding:
Read through the information to find out about Targets, Conditional Formatting and CSS Styling. In addition, click on these links to watch recording of our drop-in clinics:
Targets
In the context of Reporting in Workbooks, Targets enables you to define, manage, and compare expected performance values against actual Report data. Targets are designed to provide a consistent way to measure performance across Reports, Users, and time periods. They can be configured directly within Reports or managed centrally.
There are three Target Types in Workbooks:
- Calculated Targets – Get target values from a Report column
- Target sets – Centrally managed and can be used across multiple Reports
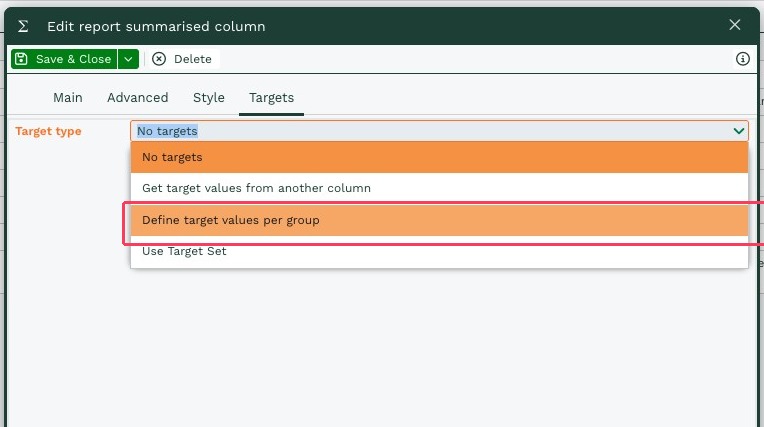
- Defined Target values per group – This is manually set for each Report
NOTE: Targets can only be added to a Summarized or a Subtotal column
Adding Targets
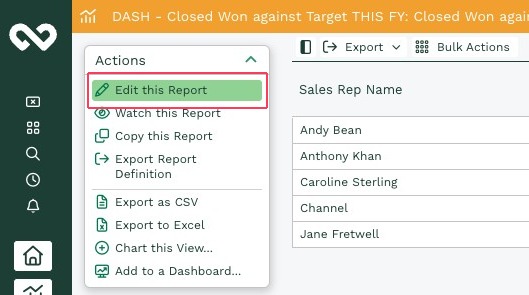
1. Navigate to your report and click “Edit this Report”
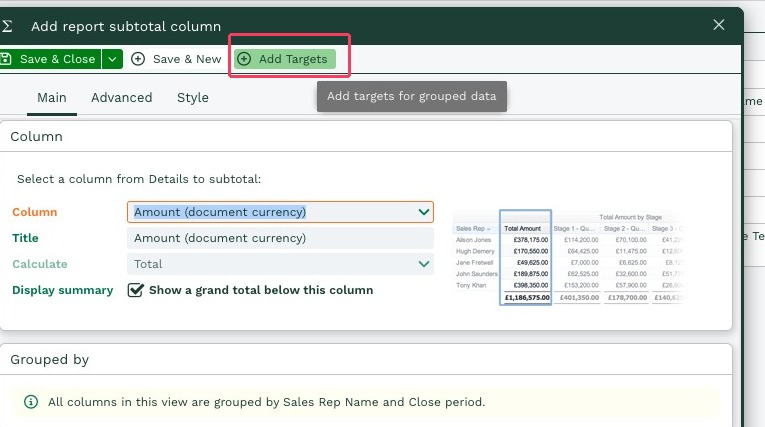
2. Locate the relevant Summarised or Subtotal column or Add a new Summarised or Subtotal column and click “Add Targets”
3. Set the Target Type
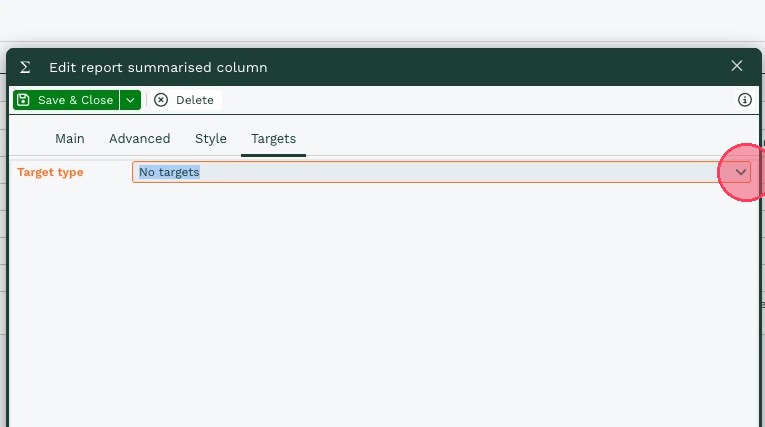
4. Select a Target Type, for example “Define target values per group”
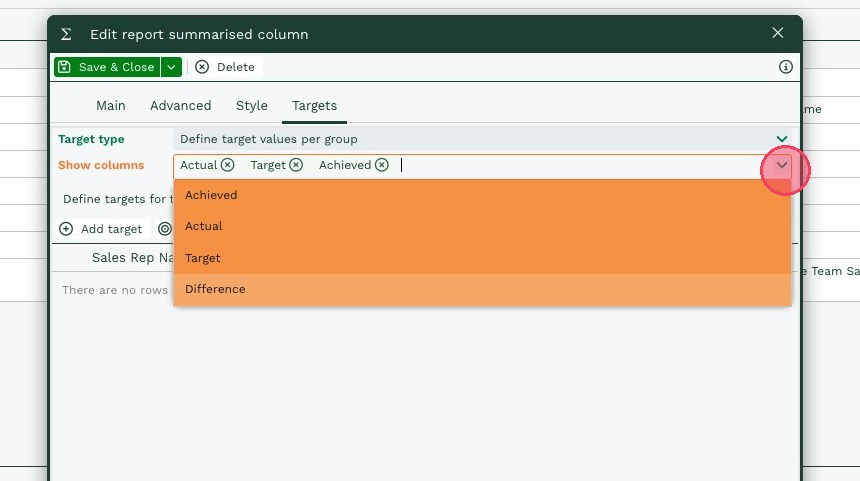
5. You can change the way in which you want the data to be calculated and displayed within the report view using the multiselect picklist shown below
Conditional Formatting
Conditional formatting allows you to apply colour and styling to your report values, making it easier to interpret Report data at a glance.
You can use this feature to highlight how results compare against targets and quickly identify trends or exceptions. Click here to watch a recording of our drop-in webinar looking at conditional formatting.
Example: Applying Conditional Formatting for Target Columns
Targets has been set up for the US Sales Team, which show Net Amount of Opportunities closed this Accounting Period vs the Target for this Accounting Period and the Difference. Values in each cell of the Target columns will dictate the color formatting applied, indicating performance of each salerep at a glance.
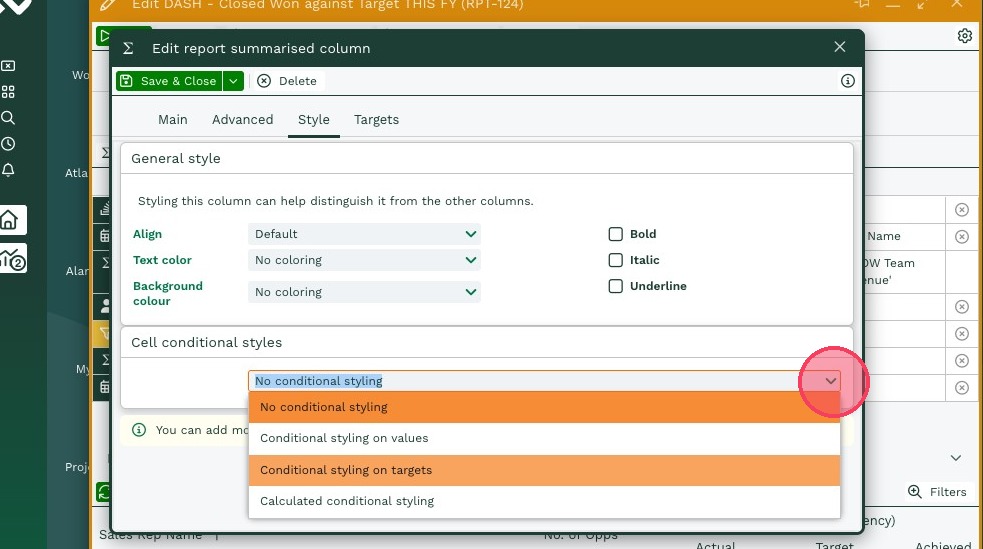
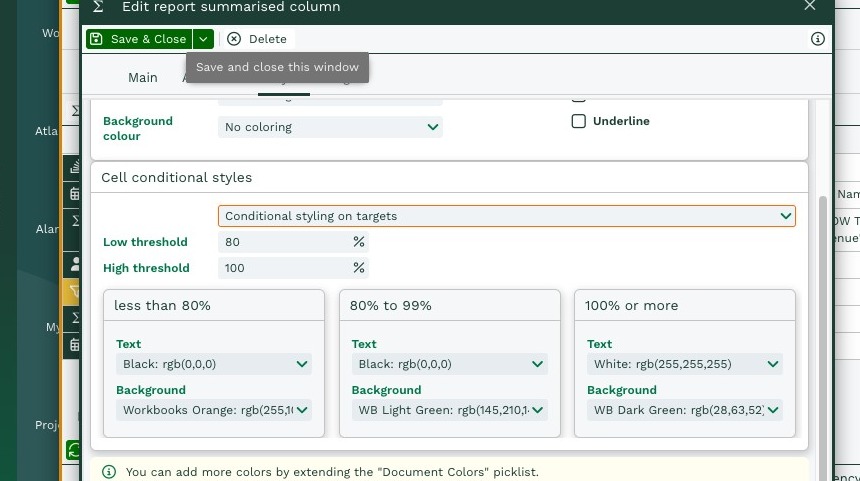
1. Navigate to Summarized or Subtotal column and click on it
2. Click on the “Style” tab, then click on the drop-down for “Cell conditional styling” and select an option. For our example we will be using “Conditional styling on targets”
3. With the targets set, we can then select the styling that we would like to be applied to the cells by defining thresholds – The upper and lower thresholds can be set as percentages by the user, and colour styling can be applied to these ranges accordingly.
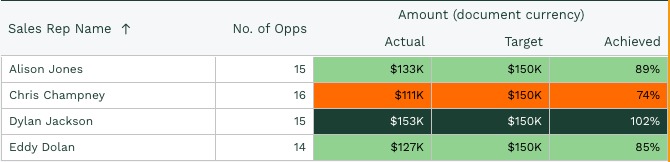
4. Using the styling and target configuration above would result in a report that gives the following sort of output – using colours to give a clear indication of performance.
CSS Styling
If the user wants more thresholds or more complex criteria, or to use more advanced CSS styling, they can use the ‘calculated styling’ option.
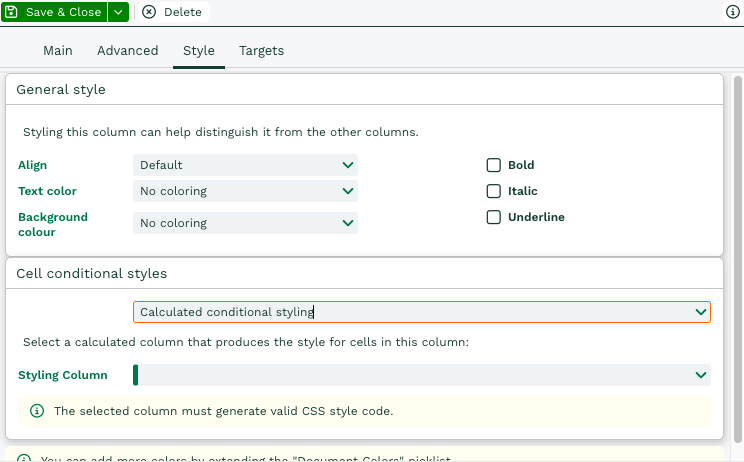
Using the CSS styling option gives the user a lot more flexibility you are no longer bound by 3 target thresholds, specific colours, and specific conditions. CSS styled columns must be set up through calculated columns to provide valid CSS code.
The opportunities for customisation of reports using CSS styling are endless for more information on CSS code, please refer here
One simple way that you can use CSS styling in reports is when looking at Account Health – Obviously, we cannot set targets based on strings of text, so CSS styling is extremely useful in these scenarios – see the screenshot below as an example
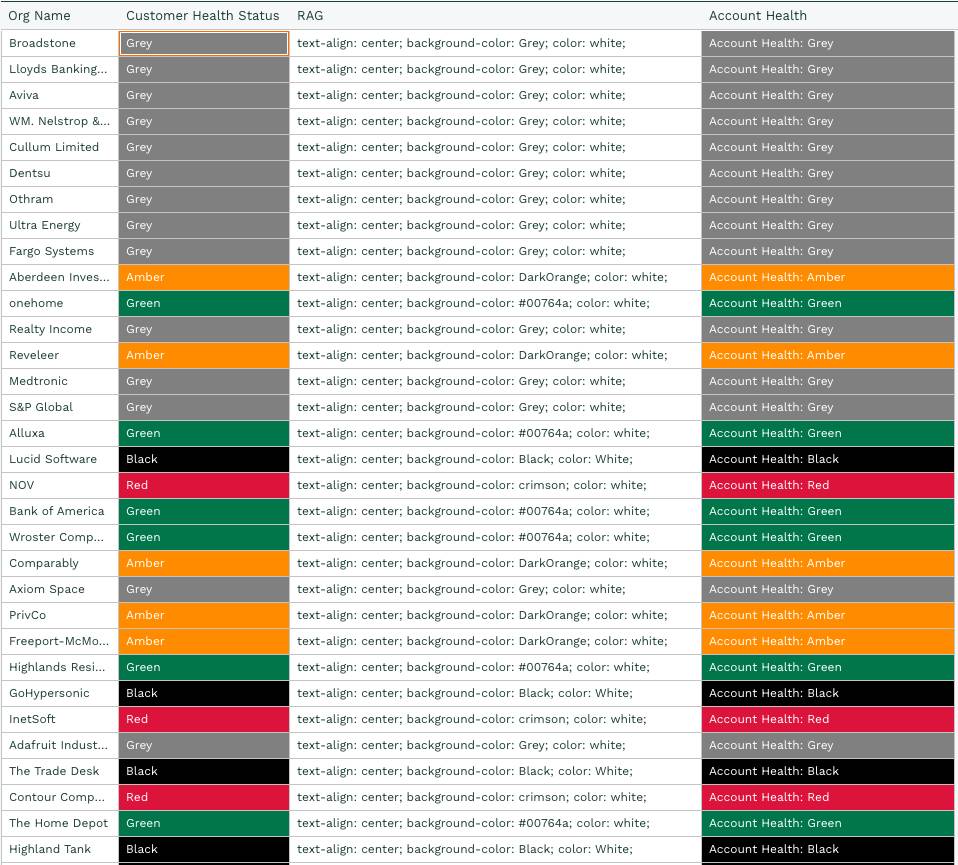
The CSS code that dictates what colour to fill the cell based on the wording is held in a separate column – this can be hidden from the report view, so that it does not make your reports look messy
If you wanted to achieve the sort of visual CSS styling “traffic light” system shown above, then this is the sort of CSS code you would need something like this
NOTE:
CASE party_organisation.cf_organisation_health_check
WHEN ‘Red’ THEN ‘background-color: red; color: White’
WHEN ‘Amber’ THEN ‘background-color: DarkOrange; color: White’
WHEN ‘Green’ THEN ‘background-color: green; color: White’
WHEN ‘Black’ THEN ‘background-color: black; color: White’
ELSE ‘background-color: white; color: Black’
END
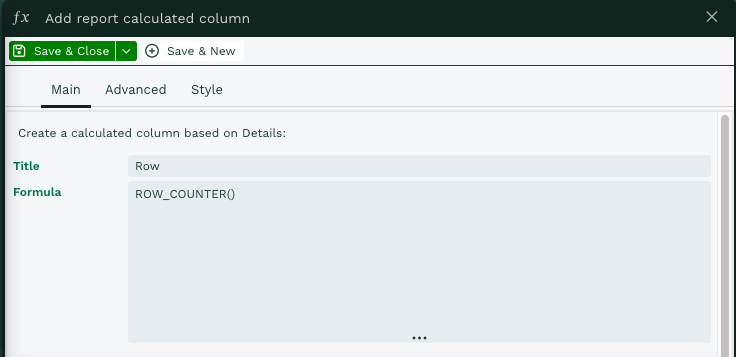
Row Numbers
Depending on what you’re trying to achieve, it might make sense to include a row number next to each line of data. This can be done easily using the ROW_COUNTER() function, simply add a Calculated Column and type the code ROW_COUNTER(), or navigate to Reporting functions > ROW_COUNTER in the function builder.
The result will be a grid that looks something like this: