





Excel
Note: You can use the technique below to export data from a Workbooks report directly into Excel. It also works with Google Sheets, as explained later in this article. here.
Workbooks gives you several ways to export data to Excel for further analysis or import into another system. If you regularly export the same report, you can save time by connecting Excel directly to the report’s download URL. Once set up, Excel can refresh the report using the same URL, keeping your data up to date without needing to manually export it each time. This guide shows you how to set up and use this connection.
Step 1 - Create an API key
Create an API Key with access to the reports you want to export. To do this, go to Start > Configuration > Automation > API Keys and click New API Key.
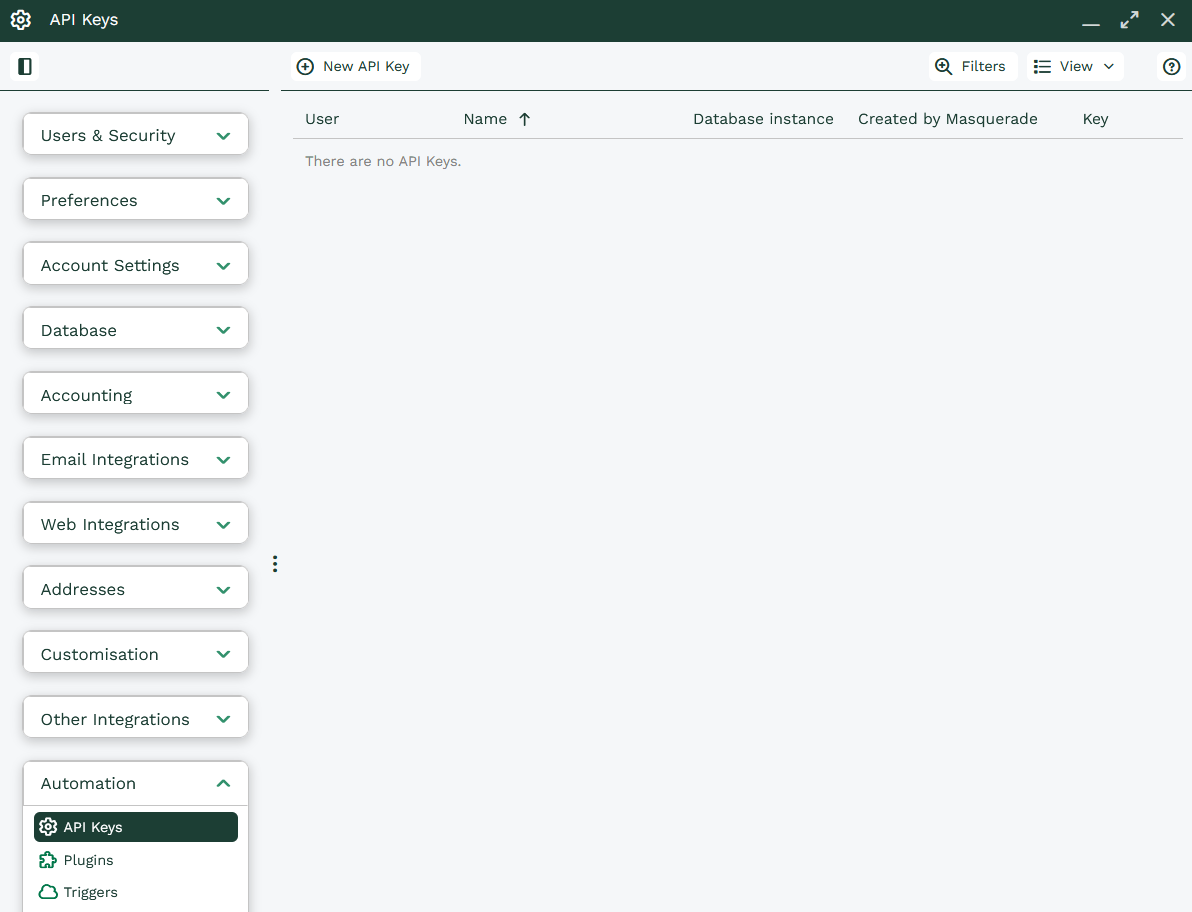
A new window will open where you can configure your API Key. Complete the following fields:
Access as User: Select the user the API Key will run as. We recommend using the Automation User, as it typically has access to all reports and won’t be affected by user login changes or account availability.
Name: Give the API Key a meaningful name so it’s easy to identify later, such as Excel Export or Excel Reporting.
Until: Set an appropriate date/time for the API key to expire.
Permitted IP Address: Restrict access to a set of trusted IP addresses. Enter them as comma separated values if you add multiple.
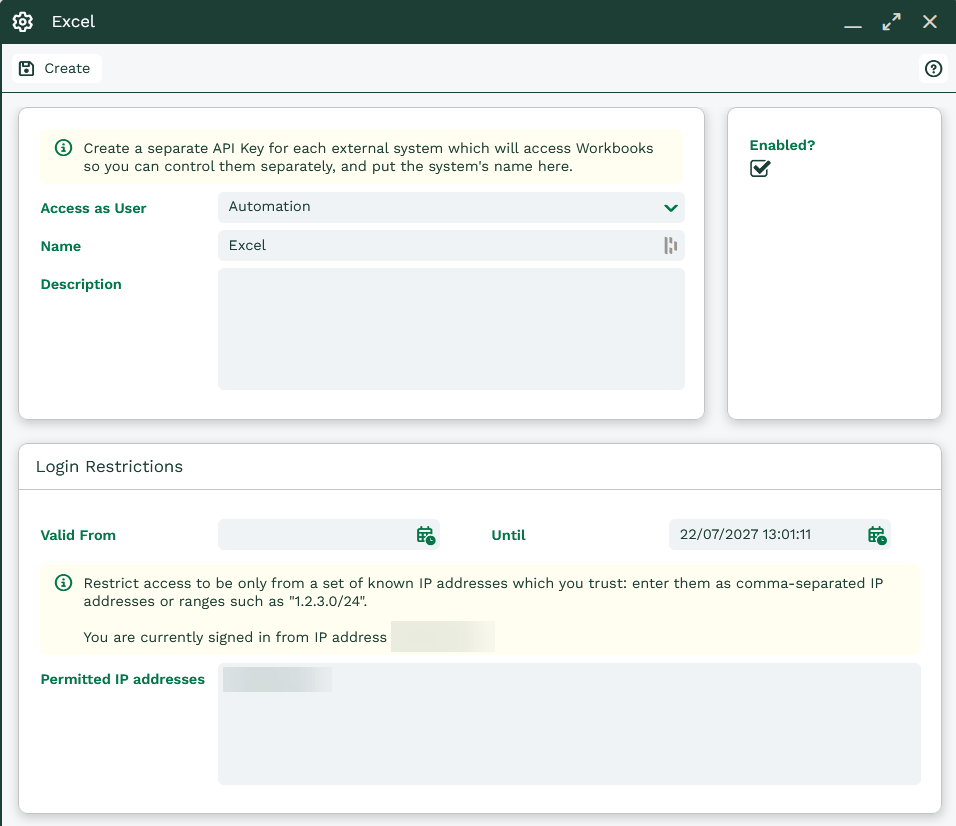
Once you’ve completed these fields, click Create. This will generate the API Key and display a new section where you can assign capabilities to it.
To allow Excel to access report data, the API Key will need the following capabilities:
- API Access
- Export Reports
- View Reports
Note
If you don't assign any capabilities, the API Key will have full access to the system. For security reasons, we recommend giving API Keys only the capabilities they need to perform their intended function.
Step 2 - Create the Report URL
You’ll now need to create a report URL for Excel to use when exporting data. Create a separate URL for each report view you want to load. For example, if your report contains five Summary Views, you’ll need five URLs.
Tip
If you're working with multiple Summary Views, you may find it easier to connect Excel to the report's Details View and build the summaries directly in Excel instead.
To create the URL, open the report you want to export and select the view you want to use, such as Details or Summary. Then click the Automation tab and select API Reference to generate the information needed.
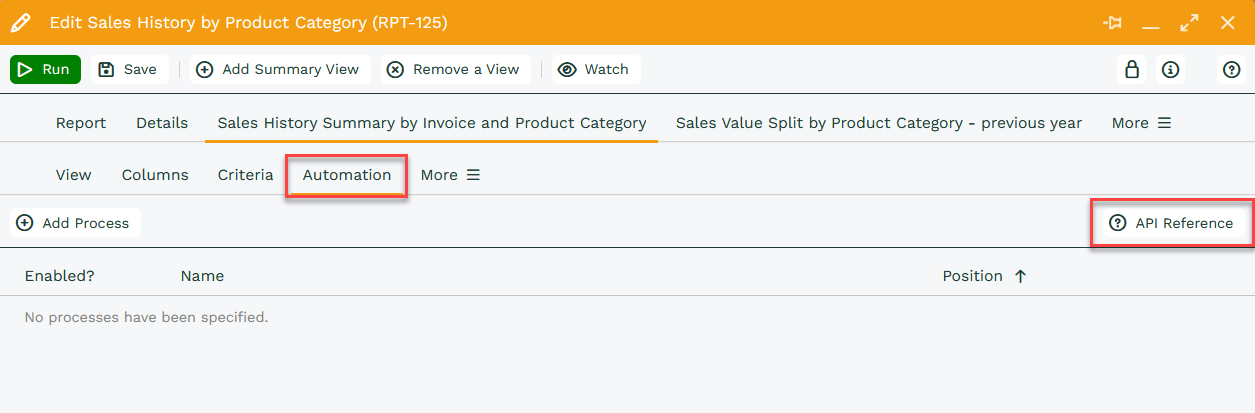
Clicking API Reference opens a new browser tab showing the API reference for that report view. You’ll need to use this page to create your report URL by modifying the URL shown in your browser.
The webpage should provide you with a URL that looks like the below:
https://secure.workbooks.com/data_view/123/data/metadata.html
Remove /metadata.html from the end of the URL and replace it with .csv?api_key=XXX replace the XXX with API Key you created earlier.
For example:
https://secure.workbooks.com/data_view/123/data.csv?api_key=79a30-8db49-b0f20-f5869-541a1-0fe74-1bb9d-873f8
Note
You may want to copy and paste this to a notepad or similar until you have entered it into Excel
Step 3 - Connect Excel to Workbooks
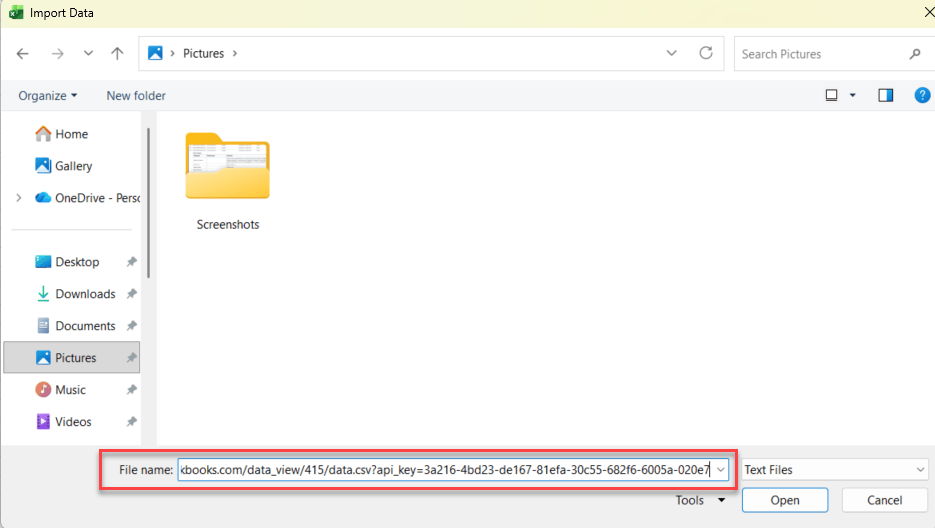
In Excel, open the Data tab > select From Text/CSV. When prompted, paste the report URL you created into the File Name field to connect Excel directly to your Workbooks report data.
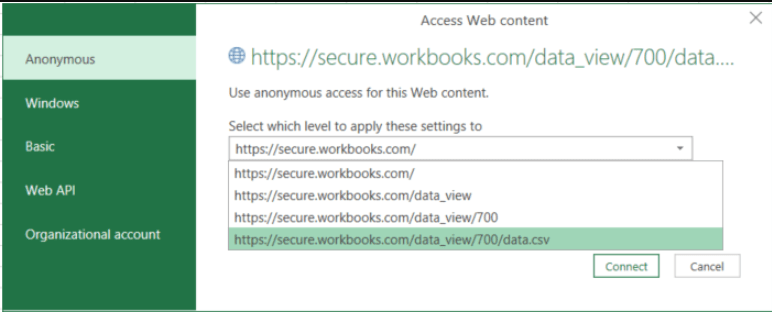
After pasting the URL, you’ll see the Access Web Content pop-up. Choose how broadly you want Excel to apply the authentication settings. You can apply access to:
- The specific Report view URL only
- All Report URLs
- Any URL that begins with https://secure.workbooks.com/
Applying access at the https://secure.workbooks.com/ level means the same authentication settings will automatically be used for any Workbooks Report URL you connect to in the future, saving you from having to configure access each time.
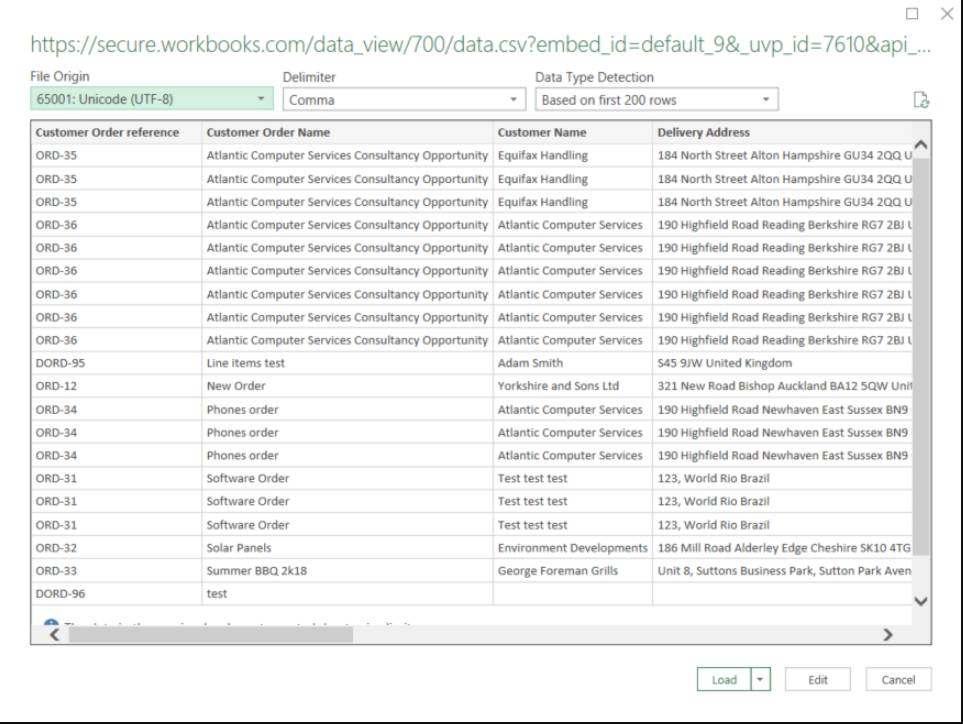
You’ll see a preview of the data that will be exported into Excel. Set the following:
File Origin = 65001: Unicode (UTF-8)
Delimiter = Comma.
You’ll also need to choose a Data Type Detection option. Depending on the size of your report, you may want Excel to analyze either the first 200 rows or the entire dataset.
Once you’re happy with the settings, click Load to import the data into Excel.
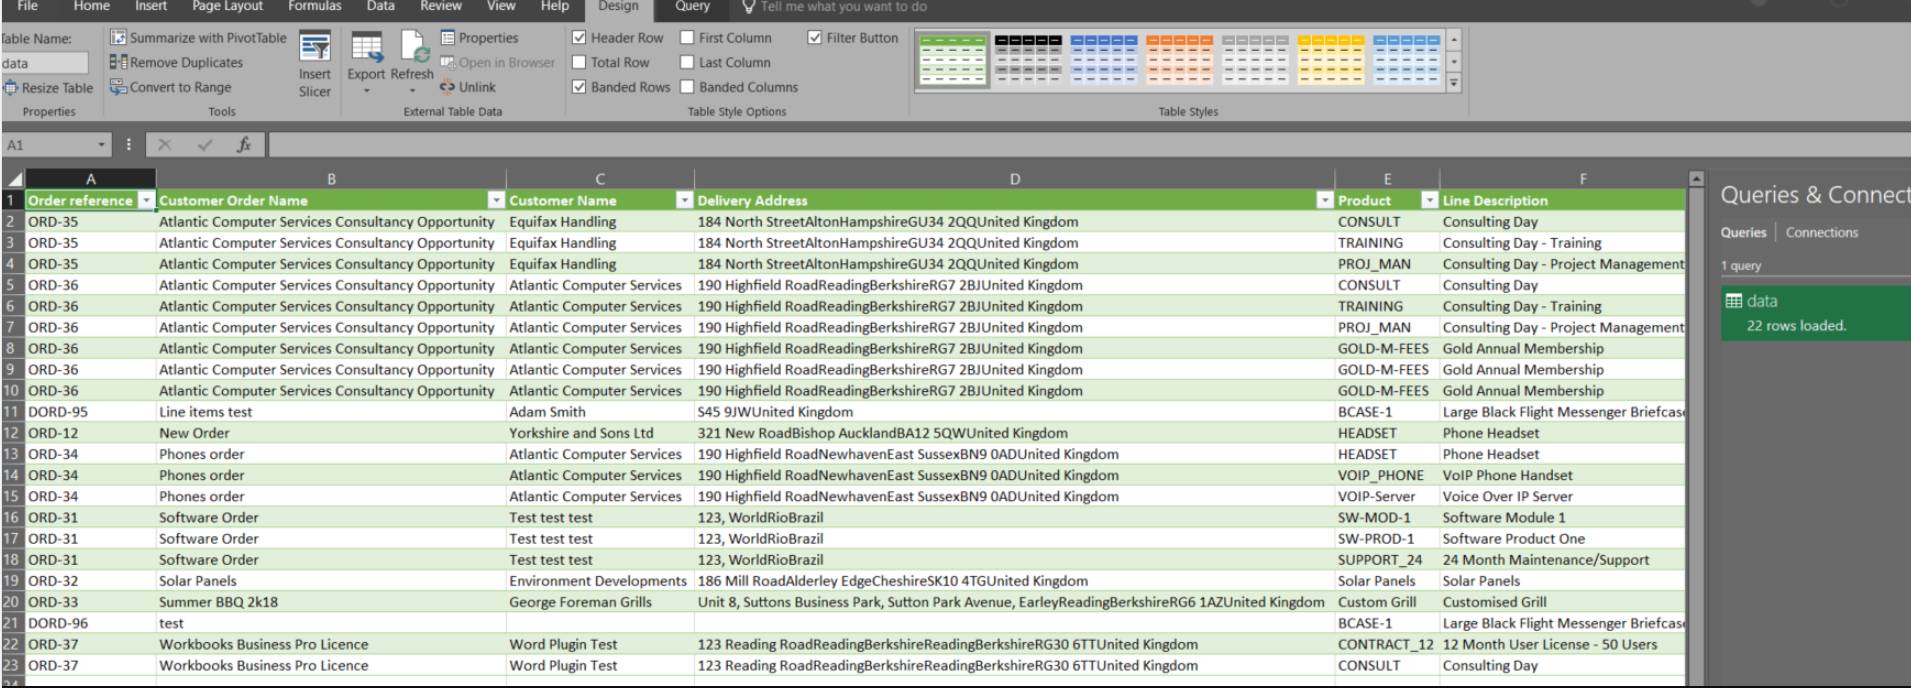
The end result!
Refreshing the Data
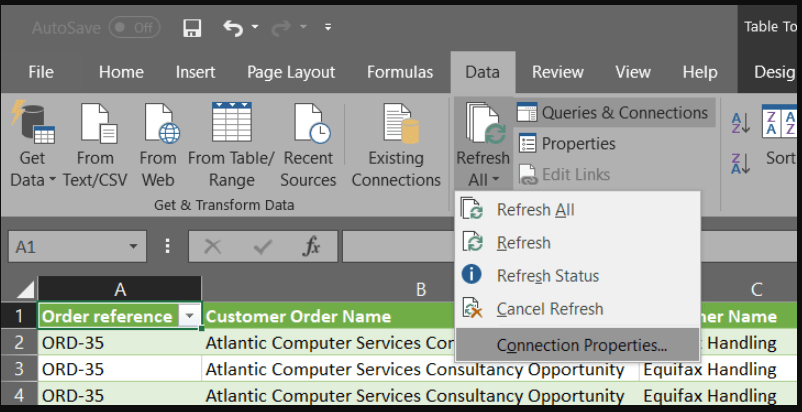
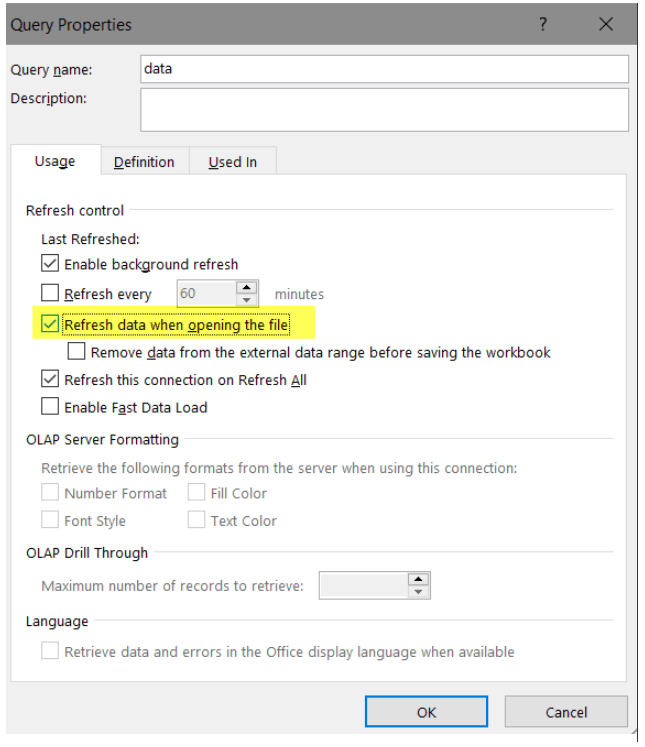
If you’d like Excel to automatically refresh the data when you open the file. In Excel go to Data > Refresh All > Connection Properties > enable Refresh data when opening the file. Excel will then update the report each time the file is opened, ensuring you’re always working with the latest data.