









Knowledgebase articles
- Welcome to the Knowledge Base
- Training
- Introduction
- Welcome to Workbooks Support: Your Go-To Guide
- Getting Started
- Preferences
- Activities
- Cases
- Introduction to Cases
- Displaying & Adding Cases
- Managing Cases
- Using the Case Portal
- Email
- Importing Data
- Leads
- Marketing
- Introduction to Marketing
- Mailshots
- Templates
- Event Management
- Compliance Records
- Spotler Integration
- What is Spotler?
- Navigating your Spotler homepage
- Introduction to GatorMail
- GatorMail Configuration
- GatorMail Hard Bounces
- Sending Emails in GatorMail
- Advanced Features
- GatorCreator
- Setting up the Plugin
- Viewing Web Insights Data on your Form Layouts
- Domain Names and Online Activities
- Reporting incorrect Leads created through Web Insights
- Reporting on Web Insights data
- Using UTM Values
- Why aren’t Online Activities being created in the database?
- Why is GatorLeads recording online activities in a foreign language?
- GatorSurvey
- GatorPopup
- Dotdigital
- Integrations
- SFTP/FTP Processes
- Docusign Integration
- DocuSign Functionality
- Adobe Sign Integration
- Zapier
- Introduction to Zapier
- Available Triggers and Actions
- Linking your Workbooks Account to Zapier
- Posted Invoices to Xero Invoices
- Xero payments to Workbooks Tasks
- New Case to Google Drive folder
- New Case to Basecamp Project
- New Workbooks Case to JIRA Ticket
- Jira Issue to new Case
- 123FormBuilder Form Entry to Case
- Eventbrite Attendee to Sales Lead and Task
- Facebook Ad Leads to Sales Leads
- Wufoo Form Entry to Sales Lead
- Posted Credit Note to Task
- Survey Monkey responses to Tasks
- Multistep Zaps
- Email Integrations
- Microsoft Office
- Auditing
- Comments
- Using Postcode Lookup
- Data Enrichment
- Reporting
- Using Reports
- Advanced Reporting
- Reporting FAQs
- Transaction Documents
- Displaying & Adding Transaction Documents
- Copying Transaction Documents
- Transaction Documents Fields Help
- Transaction Documents Line Items Help
- Printing & Sending Transaction Documents
- Managing Transaction Document Currencies
- Managing Transaction Document Statuses
- Setting a Blank Default Currency on Transaction Documents
- Credit Notes
- Customer Orders
- Invoices
- Quotations
- Supplier Orders
- Sagelink
- Configuration
- Releases & Roadmap
- Workbooks Glossary
Workbooks AI Overview
Overview page gives you a simple introduction to Workbooks AI and how it’s being used across your database. It helps you stay in control by showing what’s happening, who’s using AI, and where it’s adding value.
Overview is broken down over the five following timeframes:
- Last 24 hours
- Last 7 days
- Last 31 days
- This month
- Last month
Each timeframe breaks the data down further and displays it in an easy-to-read bar chart and a key below the chart.
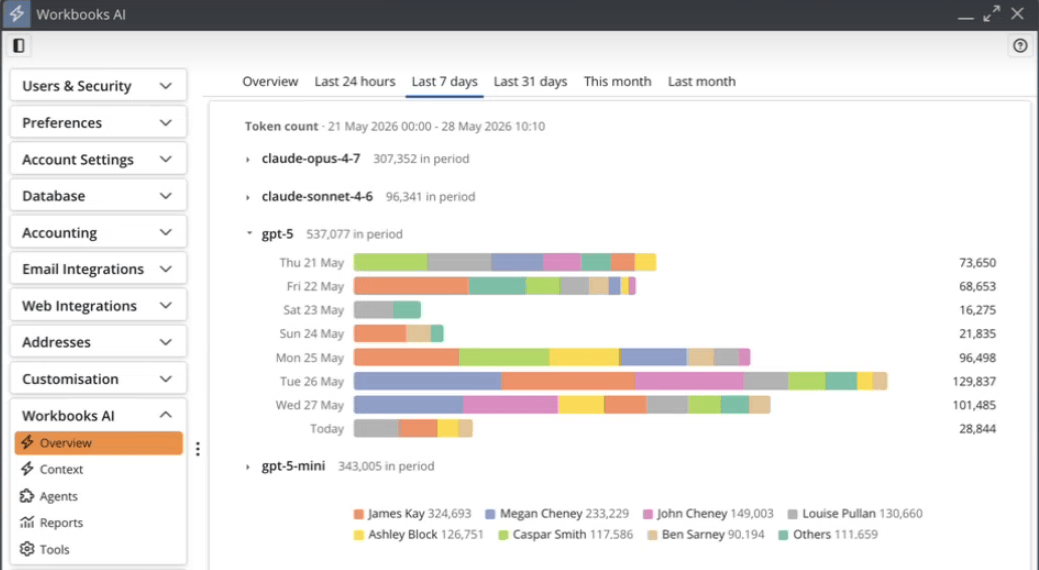
This is beneficial because at a high level, you can see:
- Who’s actively using AI day to day
- Which teams across the business are adopting AI and getting the most value
- Which AI Agents are being utilized and delivering the biggest impact
This helps to quickly see where AI is being leveraged within the business. You can spot areas that are working well, as well as teams or processes that might benefit from extra support, training, or improvement.
For more detailed analysis, you can build AI Reports within Workbooks. For more information on this, please see AI Reports.