









Process Logging
Process Logs provide a detailed record of a process run, including the steps completed, their results, and when they occurred. This helps to understand what a script is doing, identify where a process failed, and diagnose unexpected behavior.
Where to find Process Logs
You can find specific process logs by going to Start > Configuration > Automation > Processes > Select the relevant process > Click the ‘Logs‘ tab
Or you can find all process logs by going to Start > Configuration > Automation > Process Logs.
Process Log Severity
On the main tab of a process, there’s a section called ‘Logging’. This is where you can select the ‘Log Severity’ and how long the severity runs for.

There are 5 Log Severity levels, these are:
- Fatal
- Error
- Warning
- Info
- Debug
Note
We recommend using 'Debug' on processes to show all available details.
Logs tab
Within the Logs tab, there are 6 columns:
- Created at: Date/time of when the process ran and the log was created
- Script: The name of the script that ran
- Library Script: Is this a library script or custom script
- Duration: How long the process ran for
- Exit Code: The outcome of a process run
- Summary: A quick overview of a process run by displaying the last message in the logs
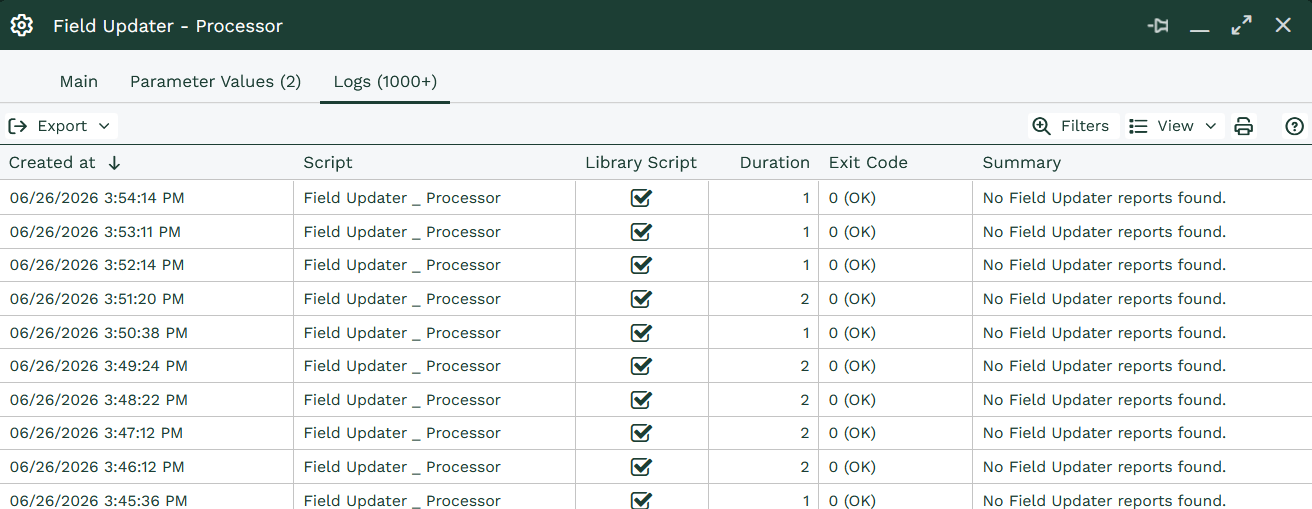
If a process runs frequently, there may be a large number of log entries. Use the Exit Code and Summary columns to quickly find runs that need attention. An Exit Code of 0 typically means the process completed successfully, while 1 indicates warnings or that the process should be retried.
Tip
If a process fails but doesn't contain much information when you click on the log. Check the 'Main' tab of the process to ensure Debug is set until a date in the future and save the process. When the process runs again, the log should contain more detail to help understand any issues.
When clicking on a log, there are 3 columns that display:
- Time: The time down to the second the step occurred
- Severity: The log level / type
- Details: A description of what happened in the step. Logs can be expanded (click the + symbol on the left side of the log, or click on the log line to open it in a separate window)
We recommend to jump to the final page of the logs and work backwards to find where the failure occurred. If you aren’t able to identify the issue, please raise a Support Case via the Case Portal, and one of our Support Analysts will investigate this for you.