- Welcome to the Knowledge Base
- Introduction
- Training
- Desktop Environment
- Preferences
- Activities
- Cases
- Forecasts & Quotas
- Importing Data
- Leads
-
Marketing
- Introduction to Marketing
- Marketing Campaigns
- Mailing Lists
- Products
- Mailshots
- Upload Library
- Templates
-
Workbooks Web Insights
- Tracking Code
- Setting up the Plugin
- Viewing Web Insights Data on your Form Layouts
- Domain Names and Online Activities
- Gator Popup
- Reporting incorrect Leads created through Web Insights
- Reporting on Web Insights data
- Using UTM Values
- Why aren’t Online Activities being created in the database?
- Why is GatorLeads recording online activities in a foreign language?
- Using HubSpot with Workbooks
- Event Management
- Compliance Records
- GatorMail Integration
- Opportunities
-
Integrations
- Mapping
- Electronic Signing Tools
- Creditsafe Integration
-
Zapier
- Introduction to Zapier
- Available Triggers and Actions
- Linking your Workbooks Account to Zapier
-
Setting up Zaps
- Posted Invoices to Xero Invoices
- Xero payments to Workbooks Tasks
- New Case to Google Drive folder
- New Case to Basecamp Project
- New Workbooks Case to JIRA Ticket
- Jira Issue to new Case
- 123FormBuilder Form Entry to Case
- Eventbrite Attendee to Sales Lead and Task
- Facebook Ad Leads to Sales Leads
- Wufoo Form Entry to Sales Lead
- Posted Credit Note to Task
- QuickBooks Online
- Survey Monkey responses to Tasks
- Multistep Zaps
-
Email Integrations
- Email Dropbox
- Workbooks Exchange Server Sync
- Workbooks Outlook Connector
-
Event & Webinar Integration Tools
- GoToWebinar
- ON24
- Microsoft Office
- Outreach
- Scribe/Workbooks Connector
- People & Organisations
- Reporting
- Dashboards
- Transaction Documents
- Auditing
-
Configuration
- Introduction to System Administration
- Users & Security
- Database
- Accounting
- Email & Integration
- Customisation
- Automation
- PDF Configuration
- Contact Support
-
Releases & Roadmap
- Roadmap
- March 2021 Release
- December 2020 Release
- September 2020 Release
- April 2020 Release
- January 2020 Release
- September 2019 Release
- February 2019 - Event Management Release
- January 2019 Release
- October 2018 Release
- May 2018 Release
- February 2018 Release
- January 2018 Release
- November 2017 Release
- September 2017 Release
- June 2017 Release
- March 2017 Release
- December 2016 Release
- August 2016 Release
- January 2016 Release
- Workbooks Glossary
Targets on Bar Charts
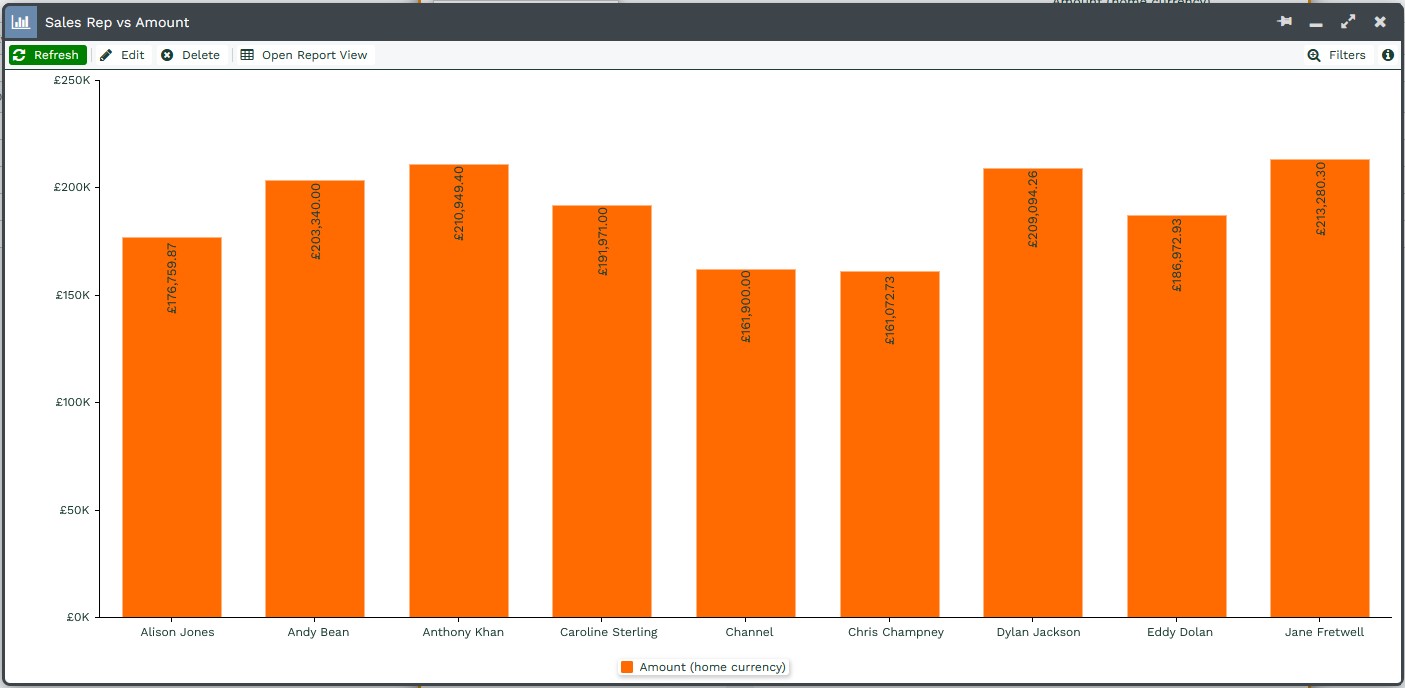
Once you have created a Bar Chart, it is possible to show the Targets from the Report on the Chart. By default, when creating a Bar Chart, the Targets will not be shown.
When editing the Bar Chart you will see a 'Show Targets' picklist within the Targets section with three options: 'No', 'Yes' and 'Yes with conditional styling'.
Note: This section will only be available if the Report View has a Target configured within it.
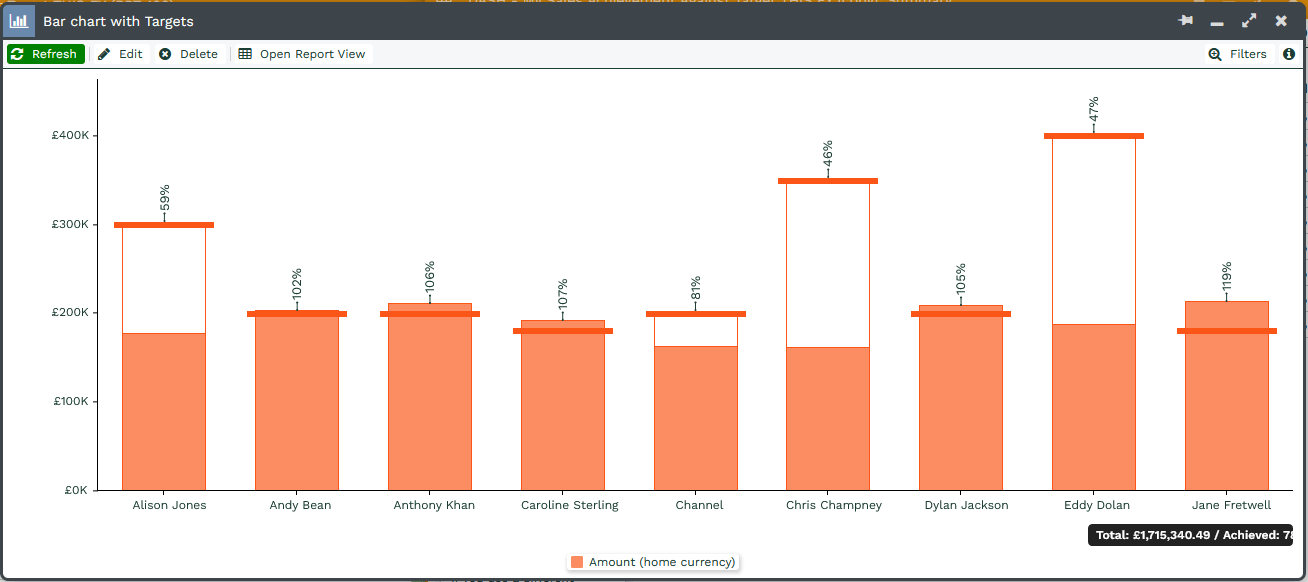
Charts with Targets
Changing this setting to Yes will create a Target bar that runs horizontally across the Bar in the Chart, or vertically if you are displaying the Bar Chart horizontally. This will appear in line with the value of the Target for the corresponding row of the Report. This allows you to see the actual data in comparison to the Target.
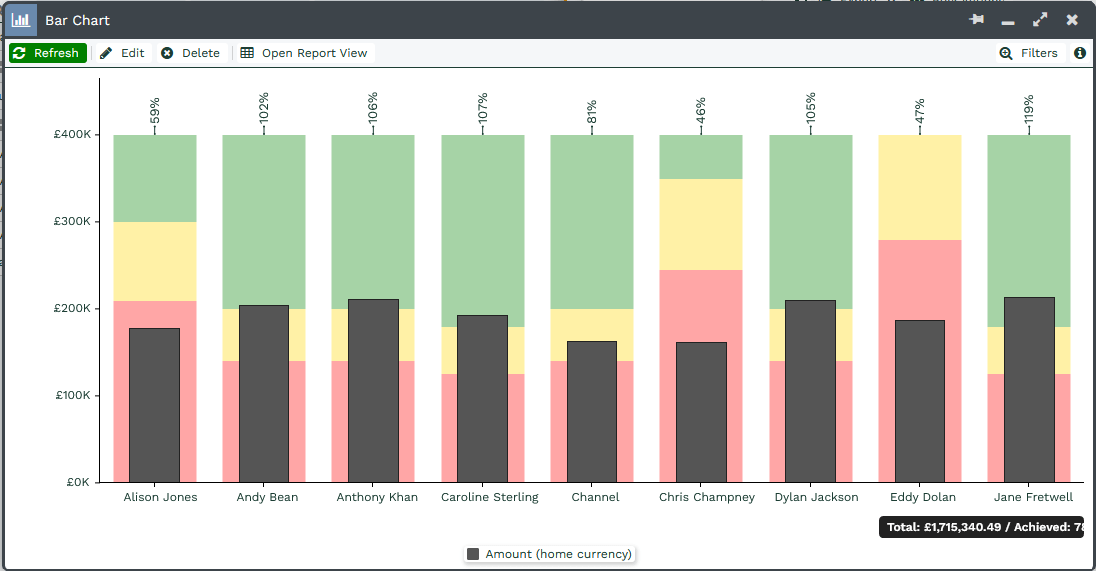
Charts with CSS Styling
CSS Styling is an excellent way to see how close to achieving a Target you are, as it applies colour coding depending on the performance against target. This styling can then be pulled from the Report to the Bar Chart in one of two ways.
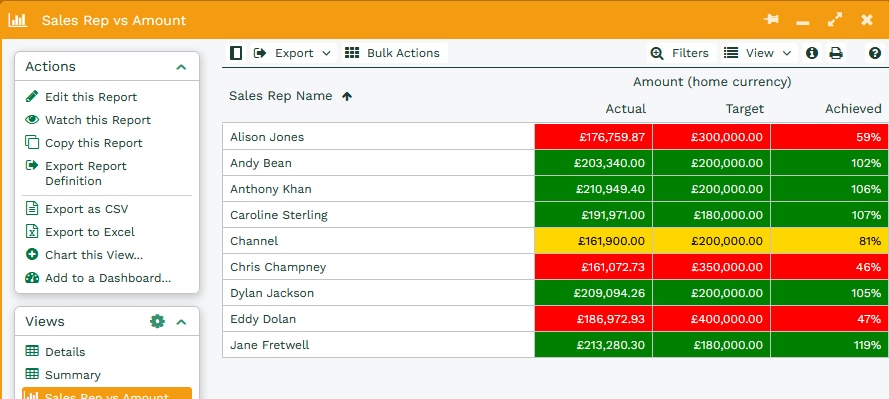
If you have set the 'Show Targets' setting to 'Yes', as well as having Styling configured on the Report, this will appear as before, showing a Target line across the Bar. However, the styling will now be applied so that the target bars will appear in the appropriate colour.
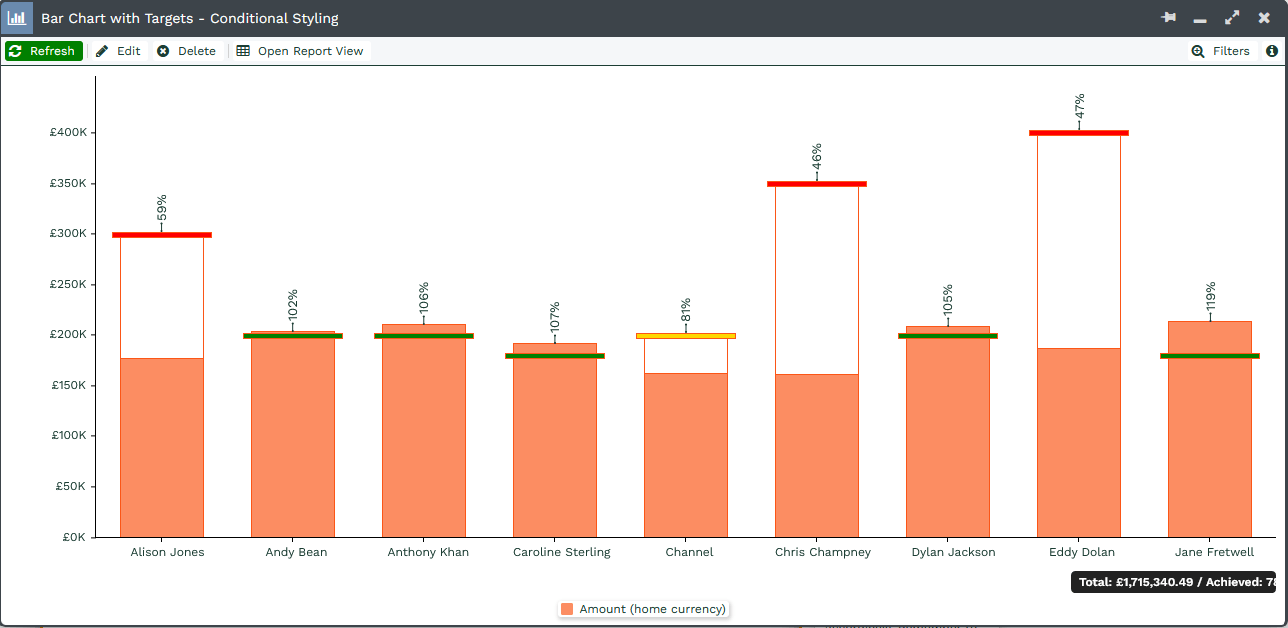
There is an additional Target setting for when CSS Styling is configured on the Report View, 'Yes with conditional styling'. Rather than create a target line across the bar, this creates a background against the bar with the Red, Yellow and Green values appearing at the appropriate values.