


Displaying Dashboard contents on a TV
If you’ve created a dashboard showcasing key business statistics, you may want to display those metrics in real time on a TV screen in your office. This visibility helps teams stay focused on their KPIs and motivates them to meet or exceed their goals. Workbooks makes it easy to create a scrolling display of reports and charts from your dashboard, so team members can monitor productivity and targets at any time.
Using Workbooks scripts, you can generate a URL that can be used on a Smart TV or with a tool such as a Raspberry Pi and give visibility of your Dashboards to your teams.
Step-by-Step guide to display Dashboard Contents on a TV
Overview
To enable the TV stats, for each Dashboard that you want to show you’ll need to set up:
- Two Public Scripts
- TV Stats _ Retrieve Dashboards
- TV Stats _ Set Reports
- A Scheduled Process
- A Web Process
1. Create/Prepare Your Dashboard
If you already have a dashboard ready to share, you can skip this step. However, if you don’t have one yet or want to add more reports and charts, please refer to the following Knowledge Base articles:
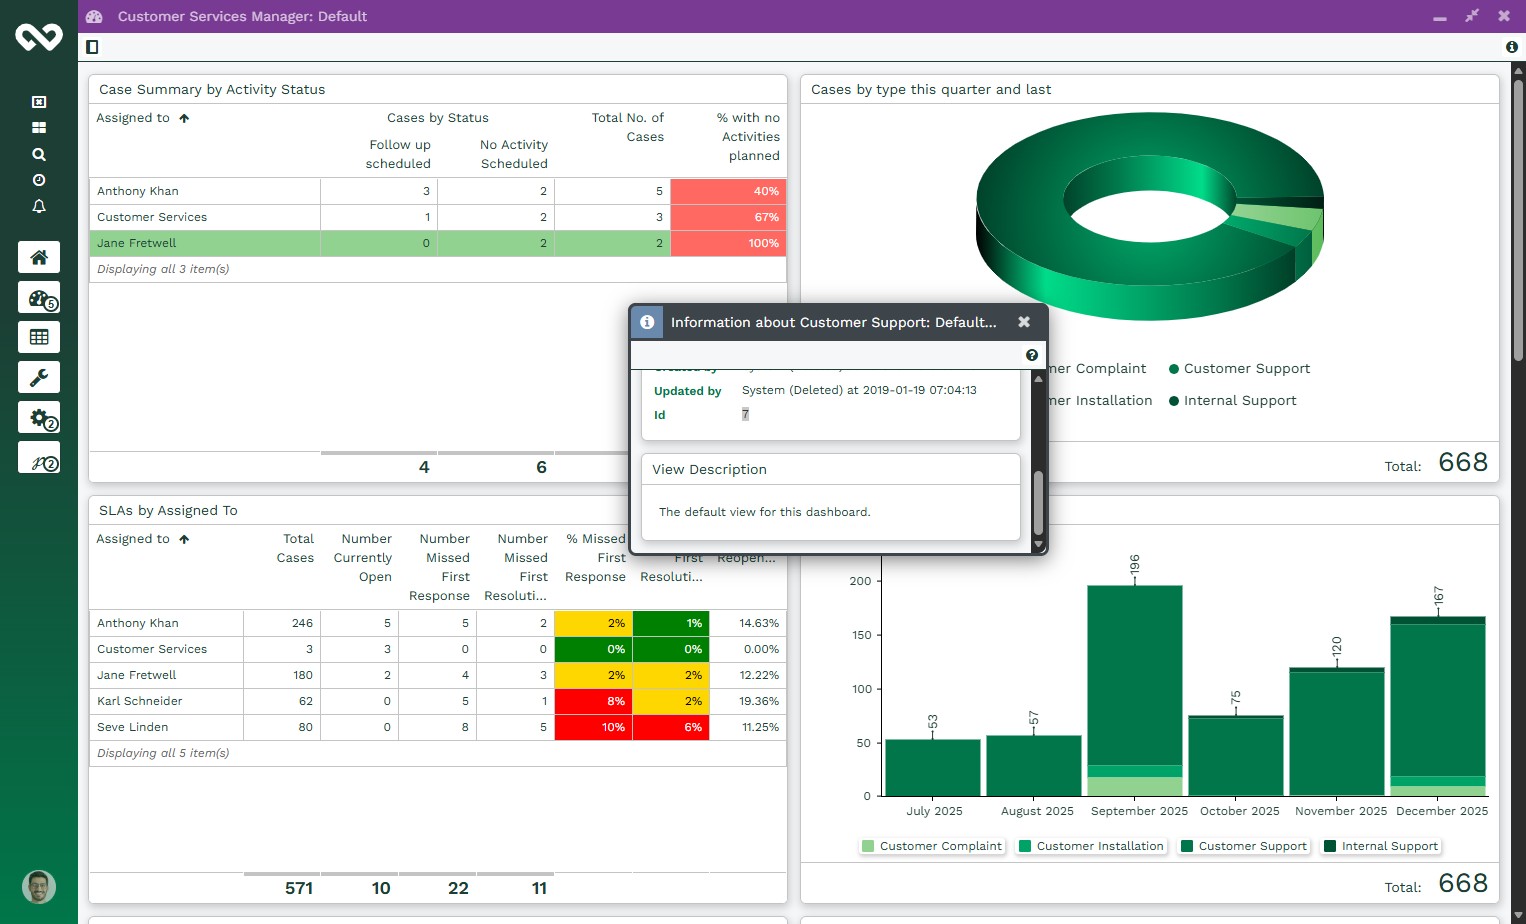
Here is Dashboard I have created, Customer Services Manager that we will be using:
Note
Do make a note of Dashboard ID as we will need this later on when setting up the Processes
2. Set Up the Scheduled Process
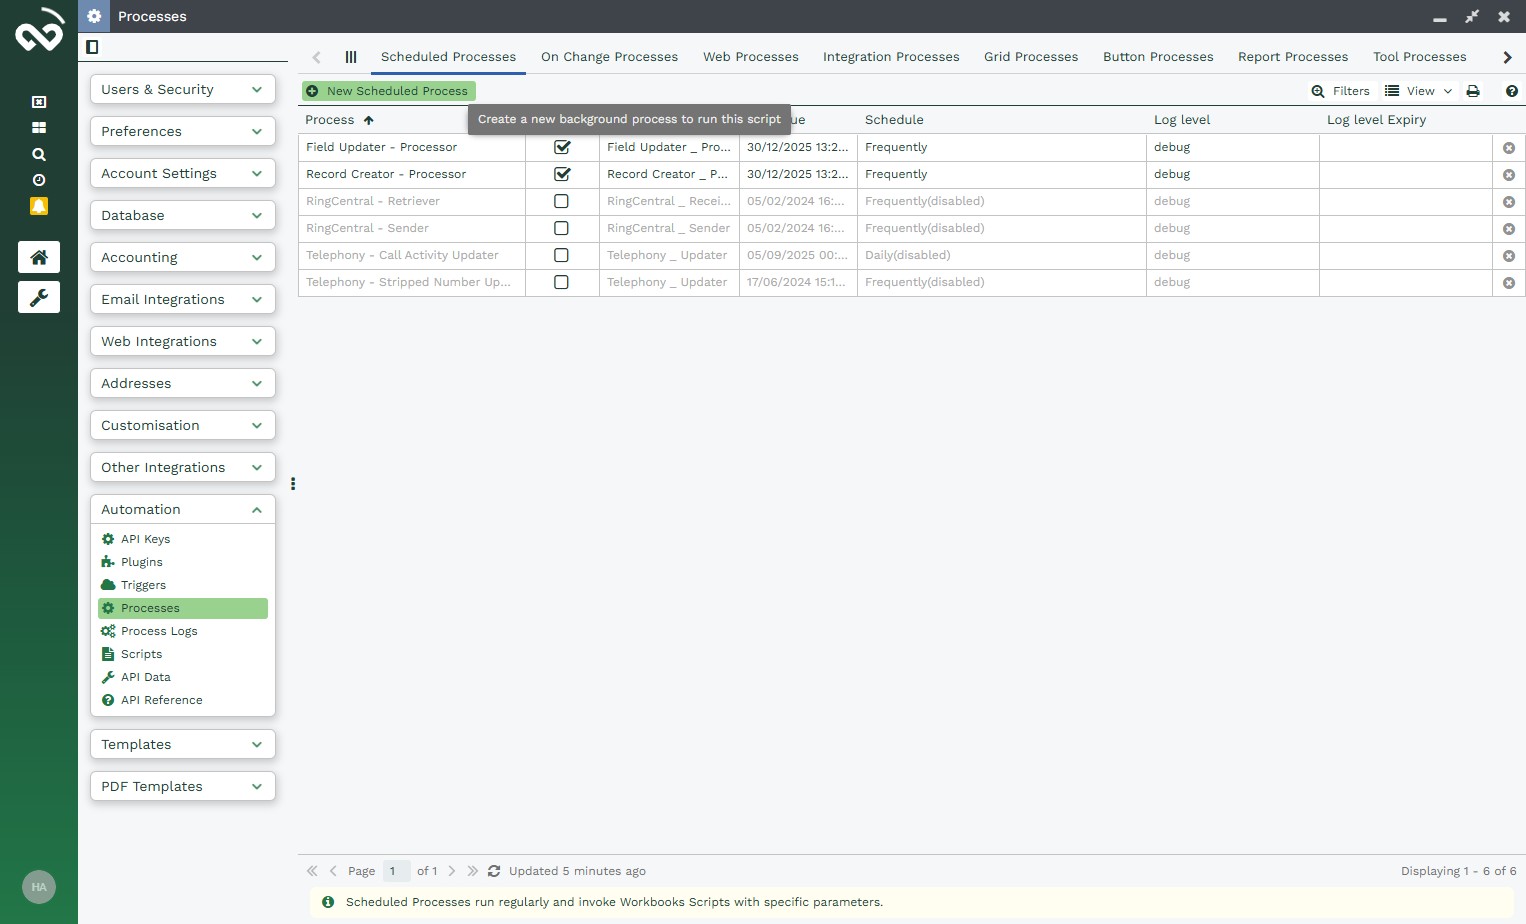
Navigate to Start > Configuration > Automation > Process > Scheduled Process tab
Click the New Scheduled Process button
Give the Scheduled Process a meaningful name an click Script Library
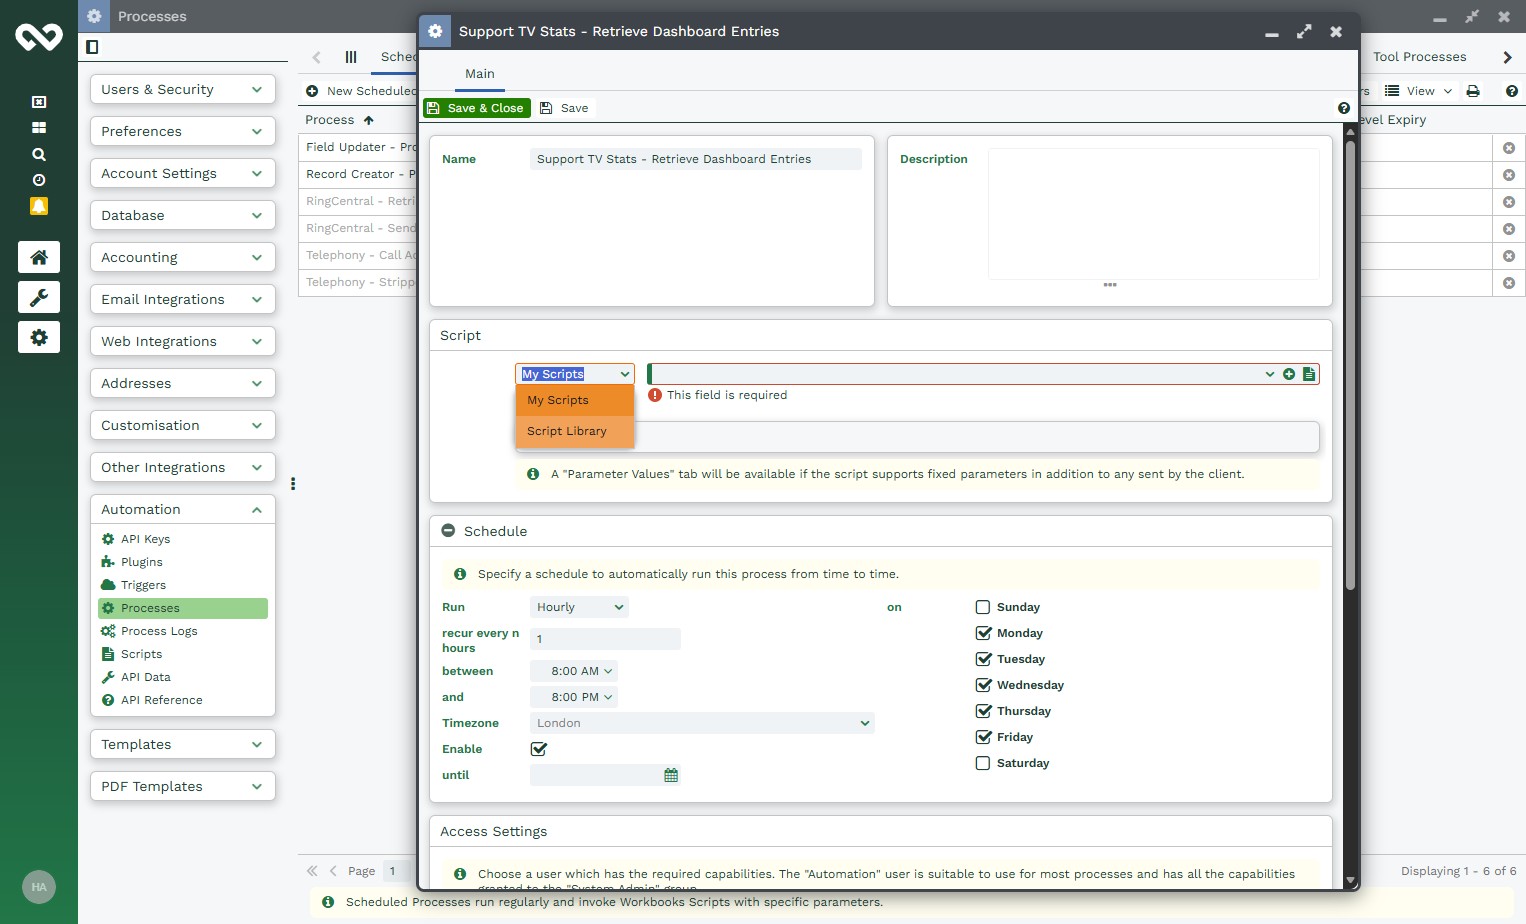
After selecting Script Library then click on TV Stats _ Retrieve Dashboards from the drop-down options
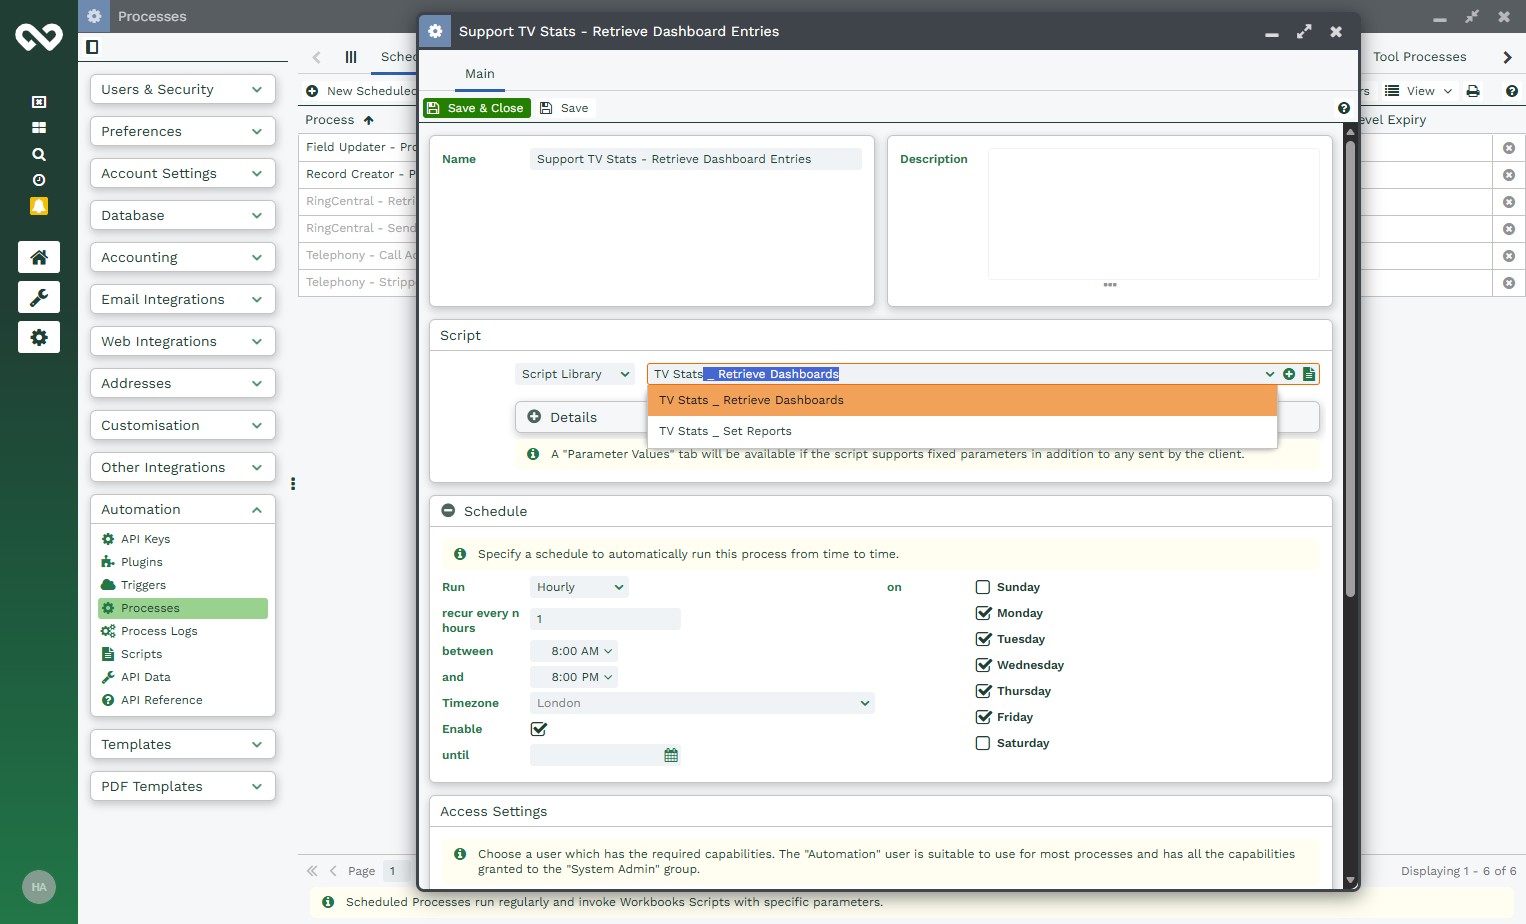
Update the Schedule to run Frequently, Recur every 5 minutes and click Save
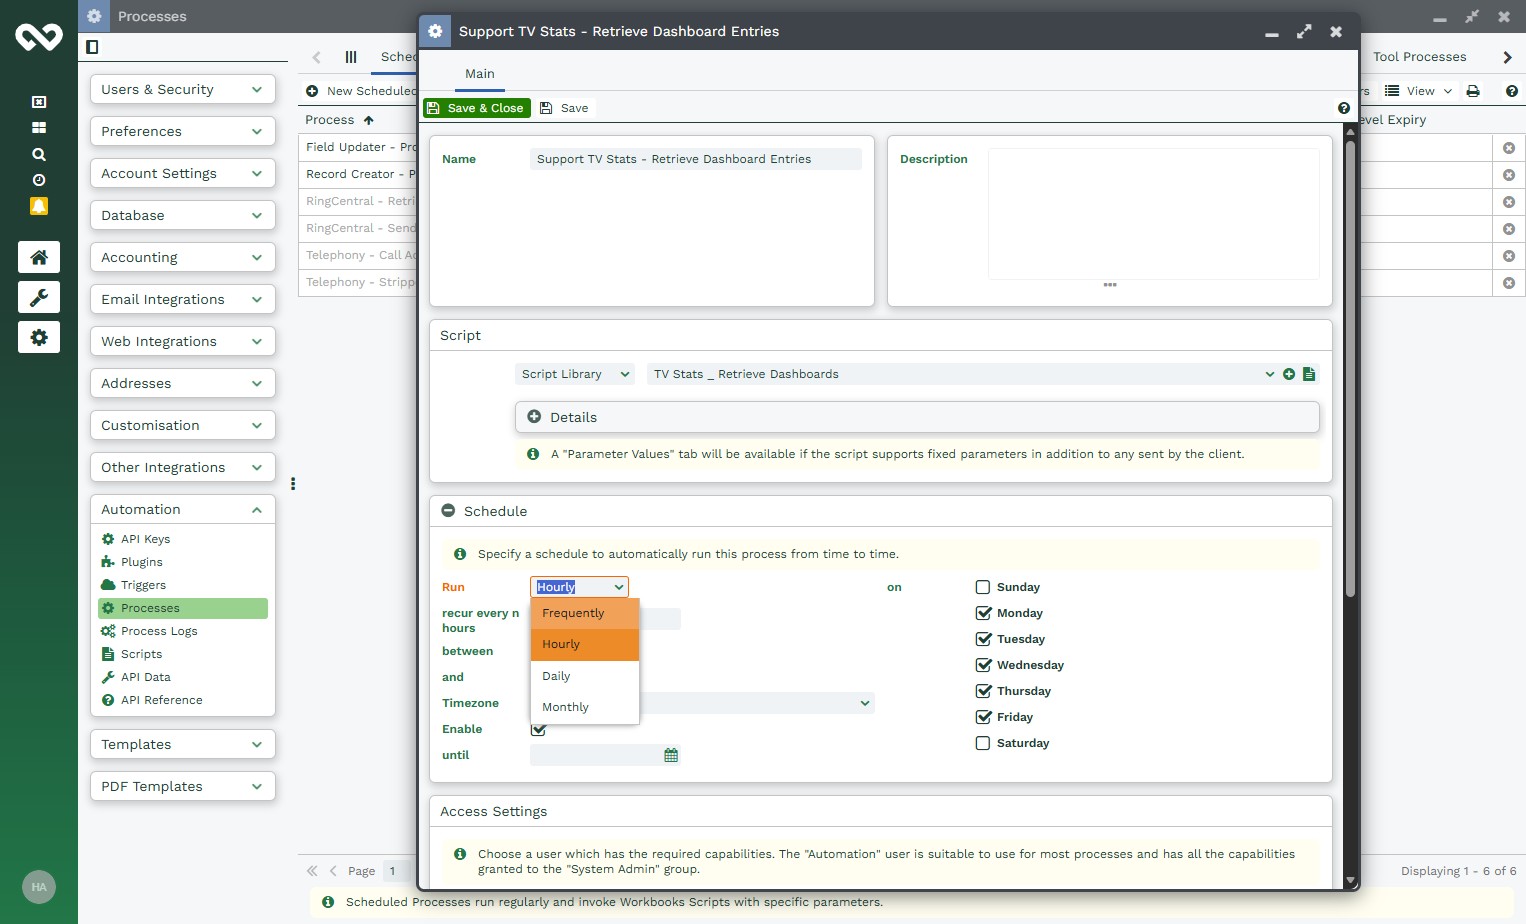
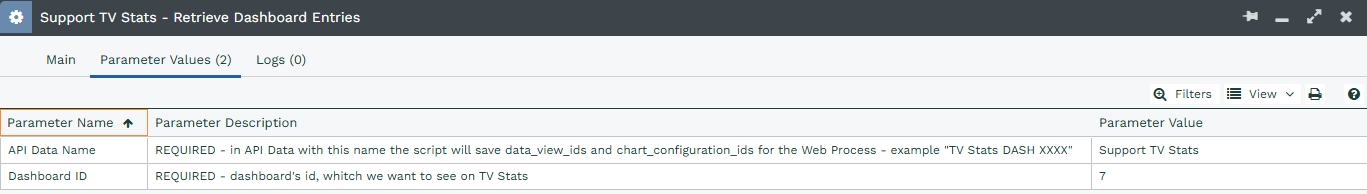
Once the Scheduled Process has been saved a Parameter tab should appear on the Scheduled Process
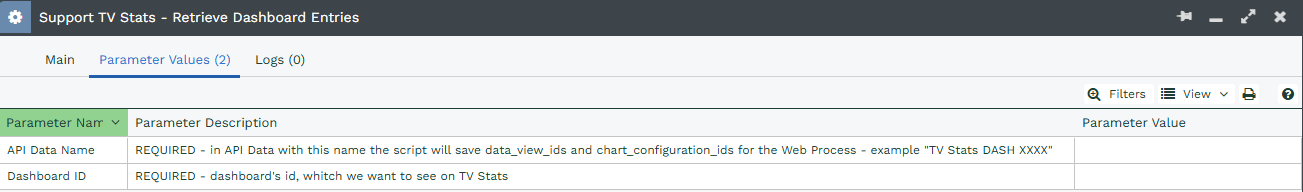
Populate the parameters, do enter the Parameter Value for API Data Name as per your preference and then the ID of your Dashboard that you would like to display.
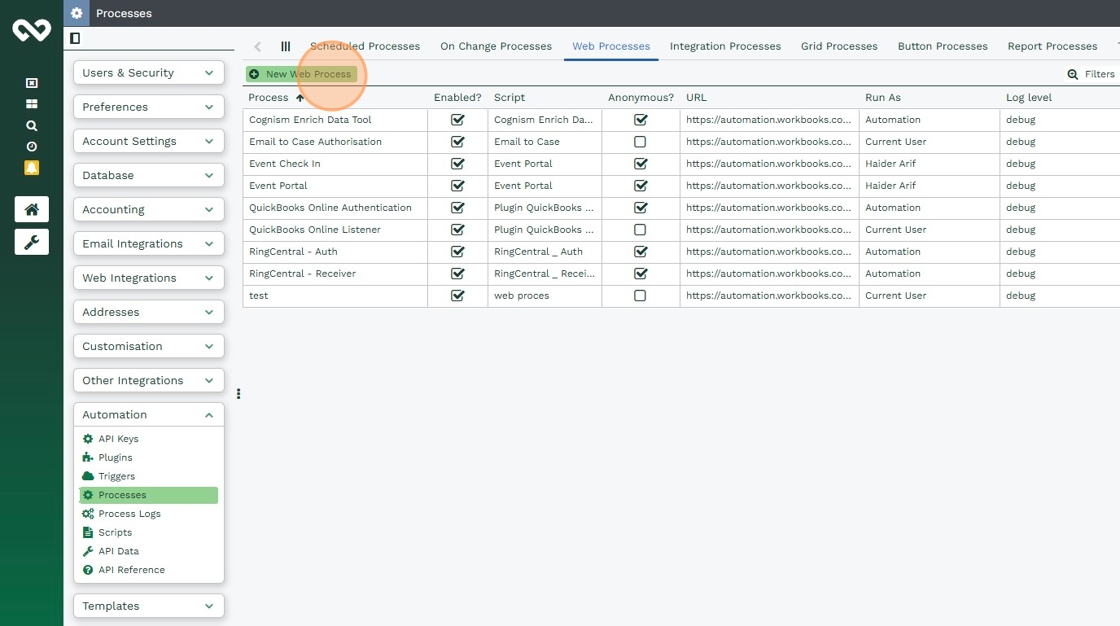
3. Set up the Web Process
On the Processes window click on Web Processes
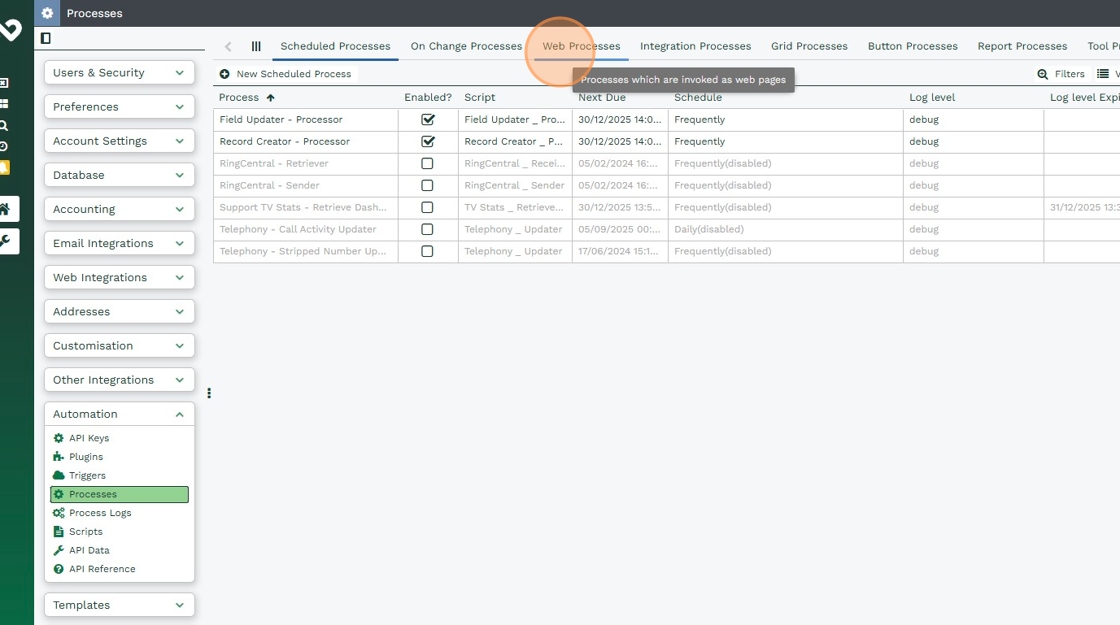
Click on New Web Process
Select the Script shown in the image below
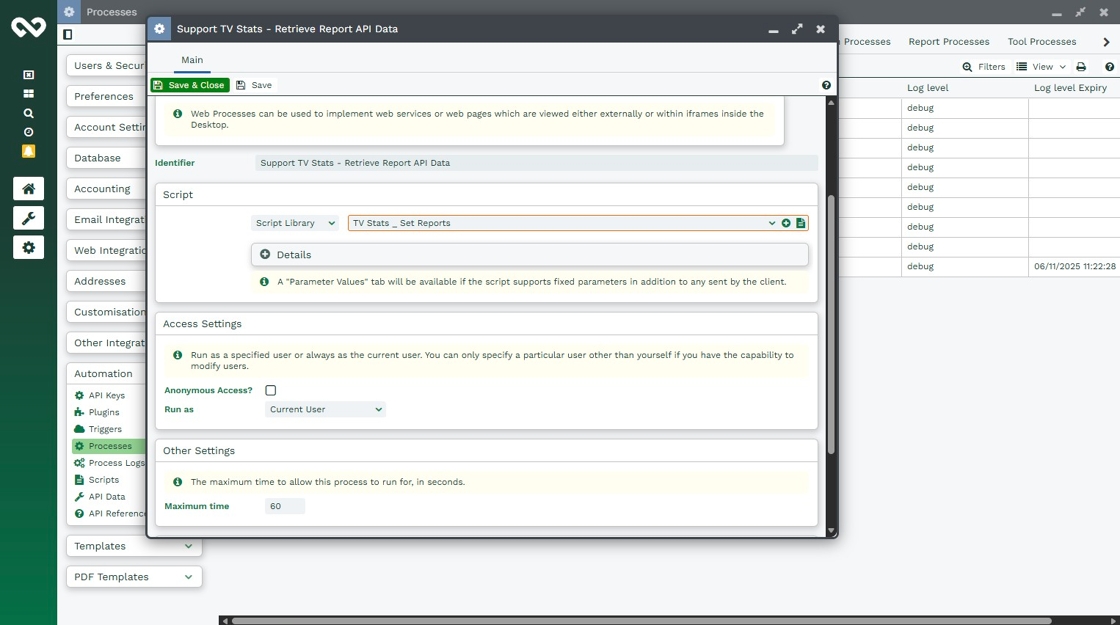
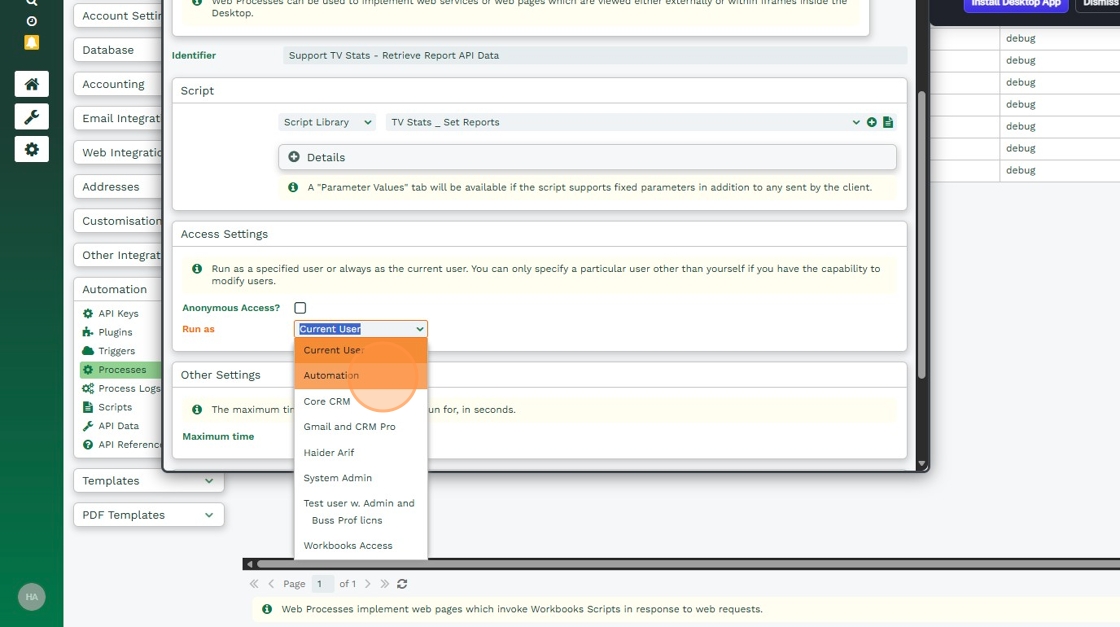
Set the Process to run as Automation and click Save.
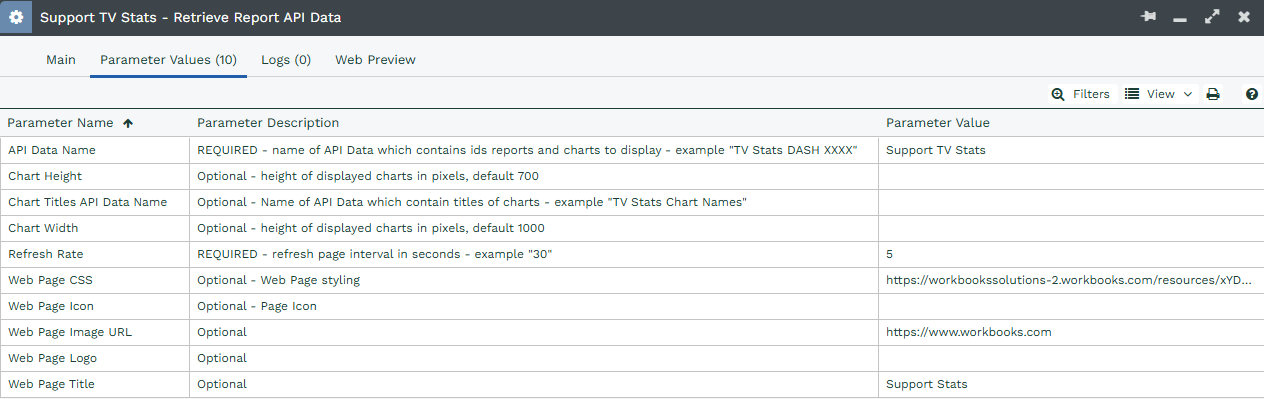
Similar to Scheduled Process we will need to update at least 2 Parameters which are required on the Web Process
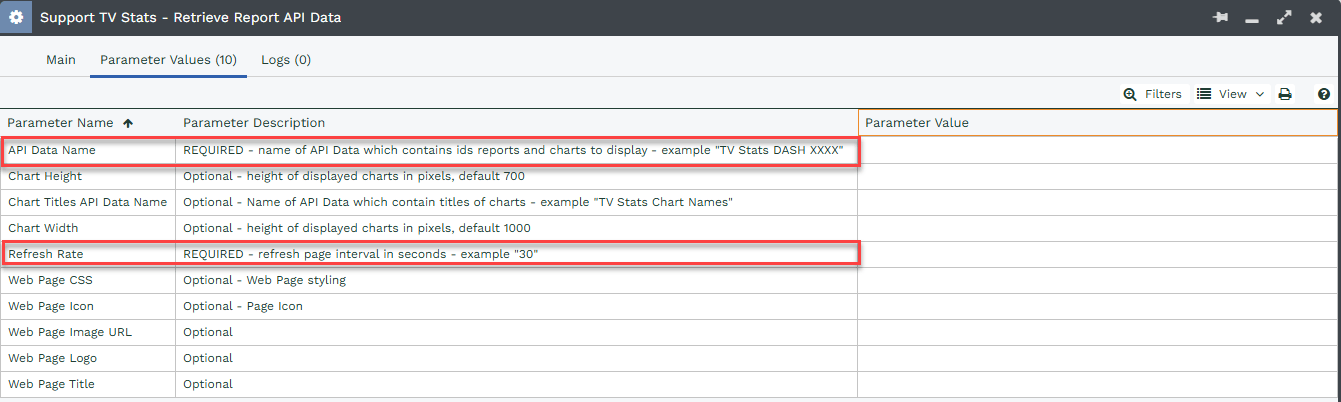
For the required Parameter values:
- API Data Name, please enter the value as per the Scheduled Process set up earlier.
- Refresh Rate, after how many seconds would you like to update.
And additionally the optional Parameters can be set up as it allows greater flexibility of how the Dashboard is displayed on the TV
4. Connect your TV via Web Process URL
Finally, make sure the display you’re using supports browser functionality. If it doesn’t, you can connect a Raspberry Pi and install a lightweight browser on the device. Then, point it to the Web Process URL to display the dashboard or have your Smart TV browser looking at the Web Process URL
