









Reporting on Opportunity Stages
This page shows you how to build a report that looks at the time taken between each Stage of your Opportunities.
This kind of report can help you spot areas of your sales process that may be causing a bottleneck, and give you insight into where your sales resources should be allocated.
Step 1: Create the report
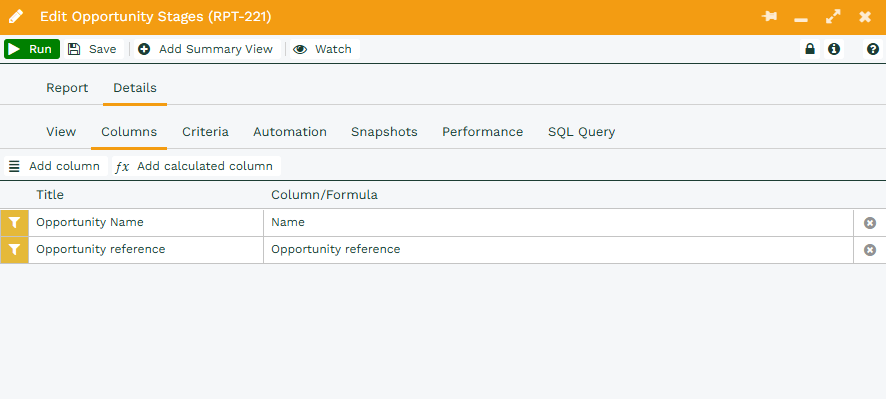
To start, create an Opportunity report and add columns for Opportunity reference and Name (shown below as Opportunity Name). It’s important to use the reference rather than the name, so that Opportunities with the same name aren’t confused with each other.
Step 2: Add a calculated column for each Stage
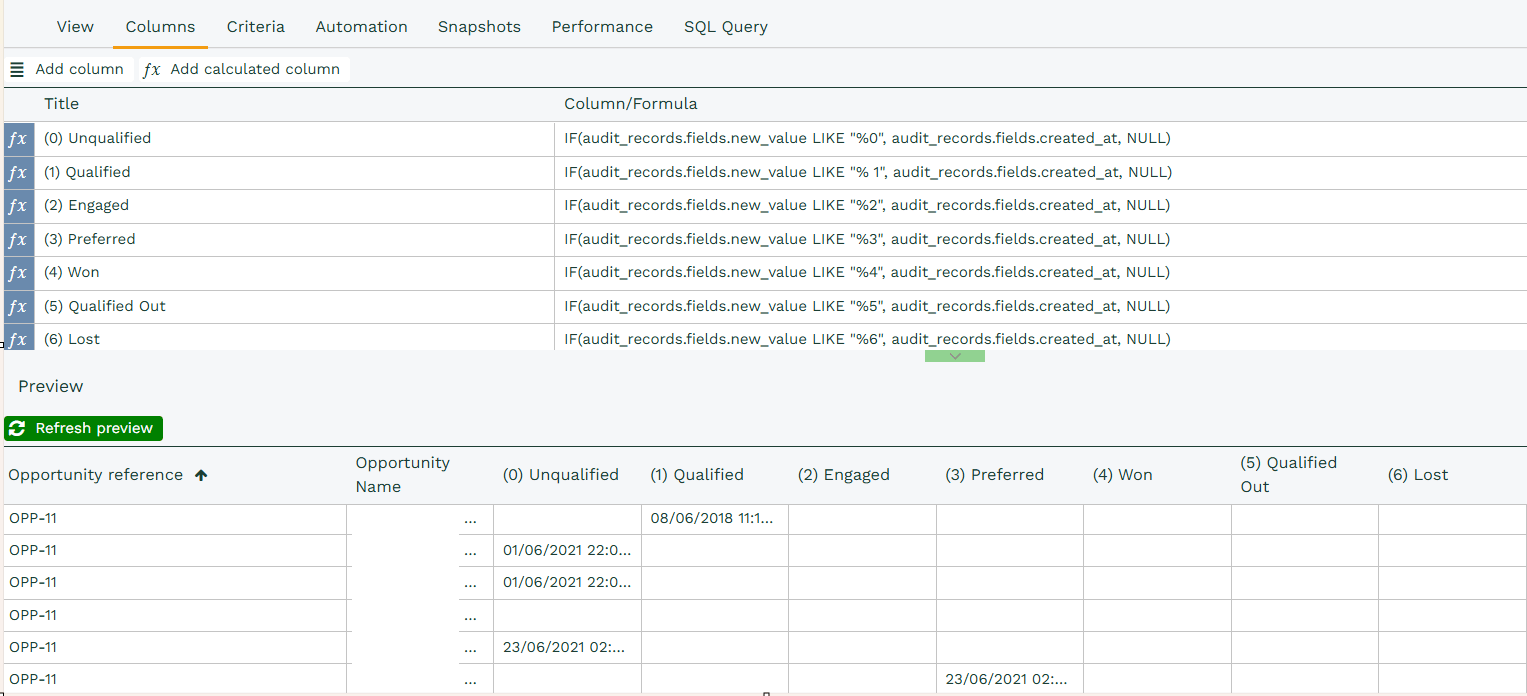
Next, add a calculated column for each Stage. These columns look at the Opportunity’s Audit records to find when each new Stage value was set.
In this example, the first Stage is (0) Unqualified, so the first column (shown below) uses LIKE "%0" in its formula to only return changes to that Stage. For the second Stage, (1) Qualified, you’d change this to LIKE "%1", and so on for each of your Stages.
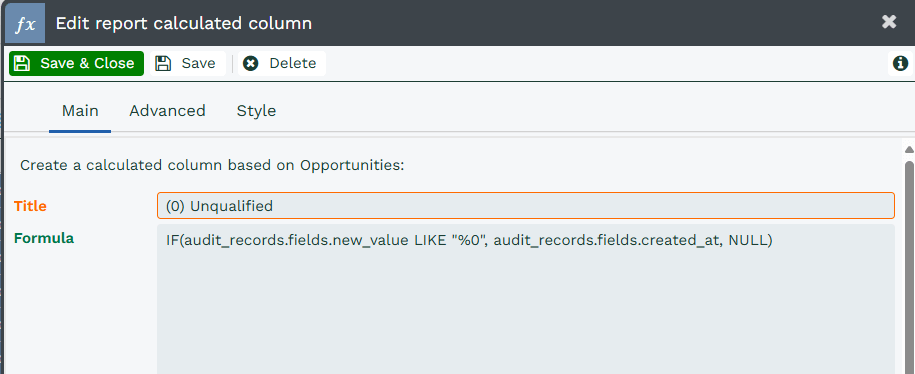
If you’d like to copy and paste the formula, here it is. Replace [stage number] with the number of the Stage the column is for:
IF(audit_records.fields.new_value LIKE "%[stage number]", audit_records.fields.created_at, NULL)
Once you’ve added a column for each of your Stages, you’ll see a screen similar to the one below.
Step 3: Filter to Stage changes only
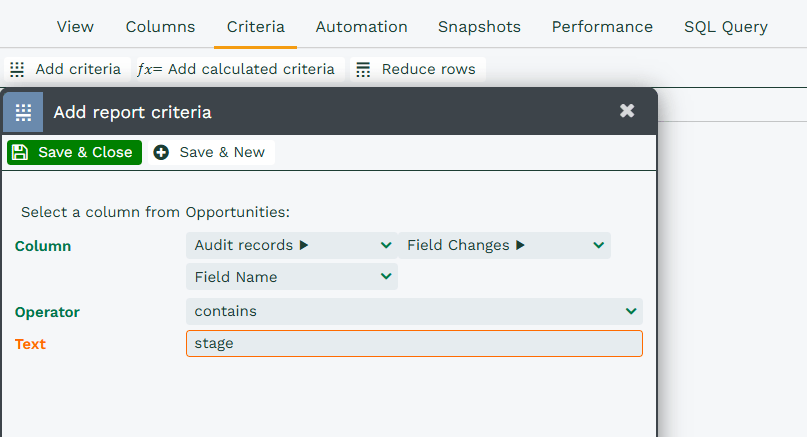
You’ll notice the data isn’t filtered to Stage changes yet. To make the report only look at the relevant Audit records, go to the Criteria tab and add a criteria on Audit records > Field Changes > Field Name, with the operator contains and the text “stage”, as shown below.
Step 4: Find the most recent date for each Stage
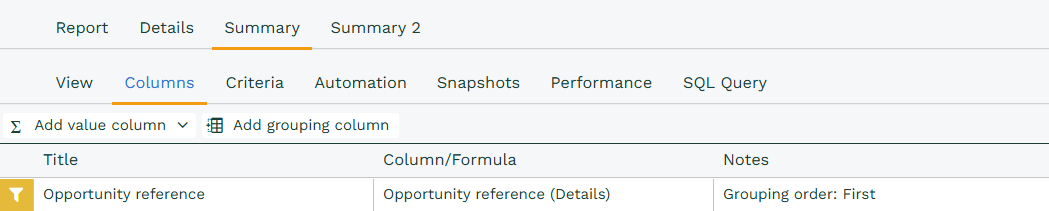
Now click Add Summary View. The first column in the Summary View needs to be a grouping column, which groups by the Opportunity reference.
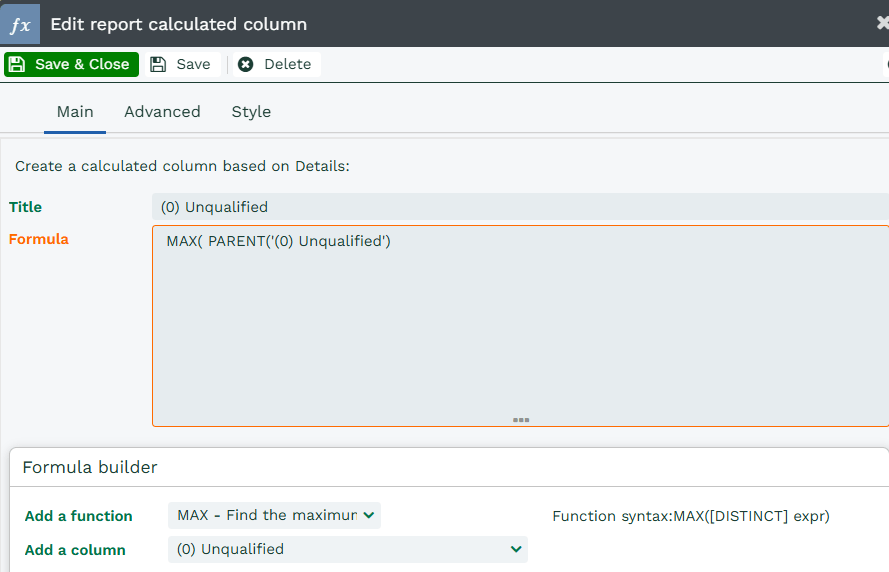
Opportunities can move forward and backward through their Stages, so you only want the most recent date for each Stage. To do this, add a calculated column to the Summary View for each Stage, using the MAX function. For example:
MAX(PARENT('(0) Unqualified'))
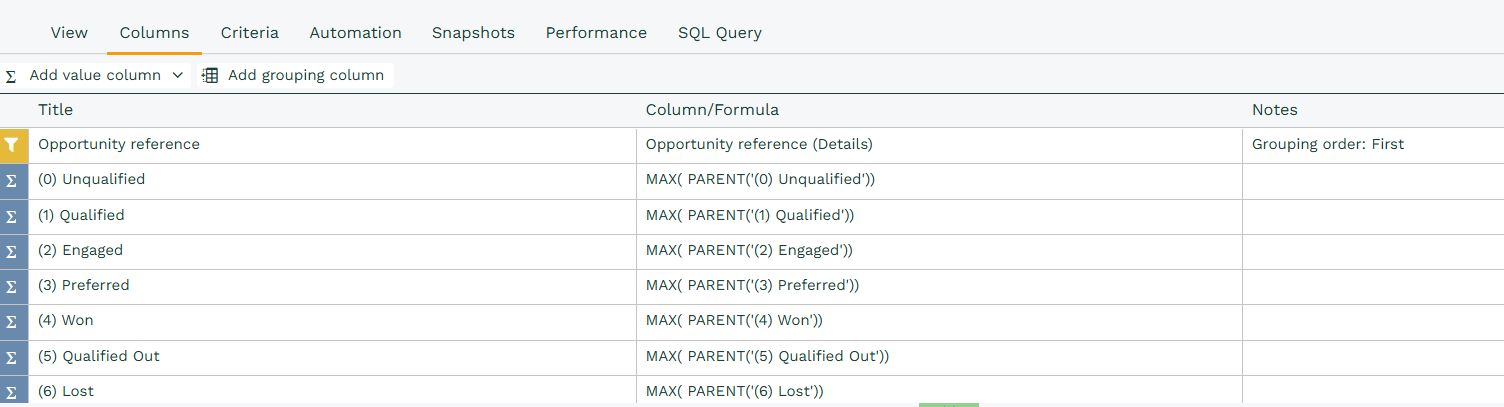
Once you’ve done this for each Stage, your screen should look like the one below.
Step 5: Calculate the days between each Stage
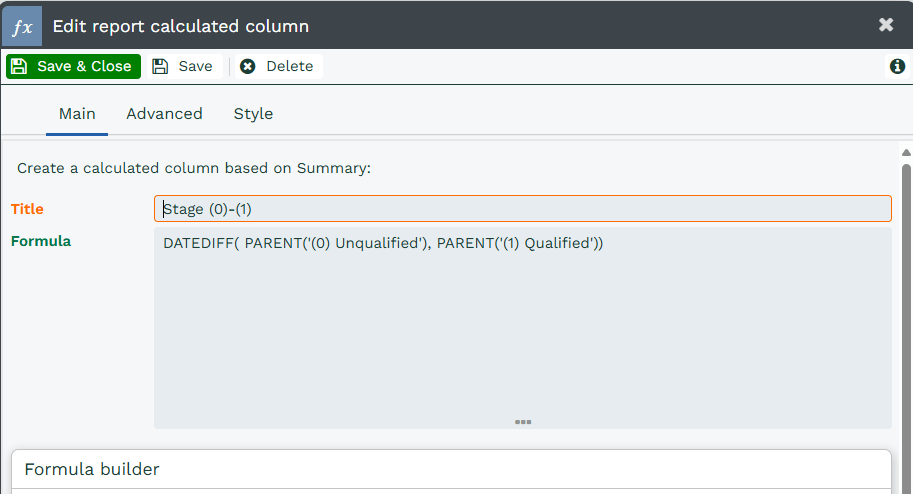
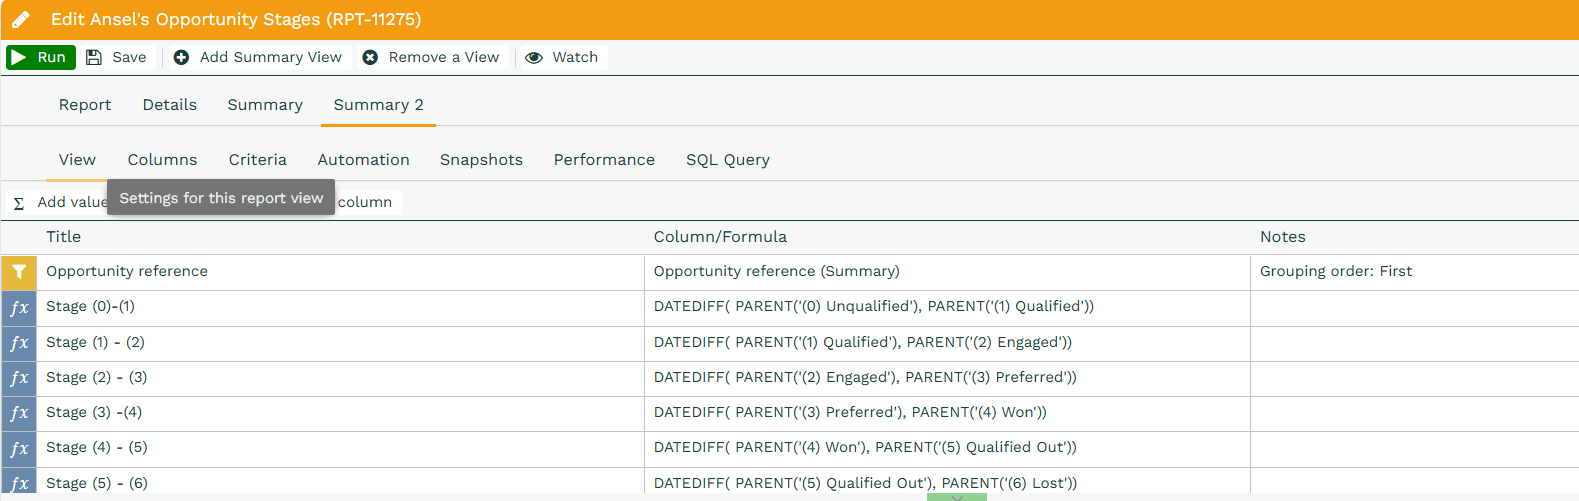
To see the time in days between each Opportunity Stage, add another Summary View, then use the DATEDIFF function to work out the difference between the dates you’ve collected. For example:
DATEDIFF(PARENT('(0) Unqualified'), PARENT('(1) Qualified'))
Once you’ve done this for each pair of Stages, your screen will look like the one below.
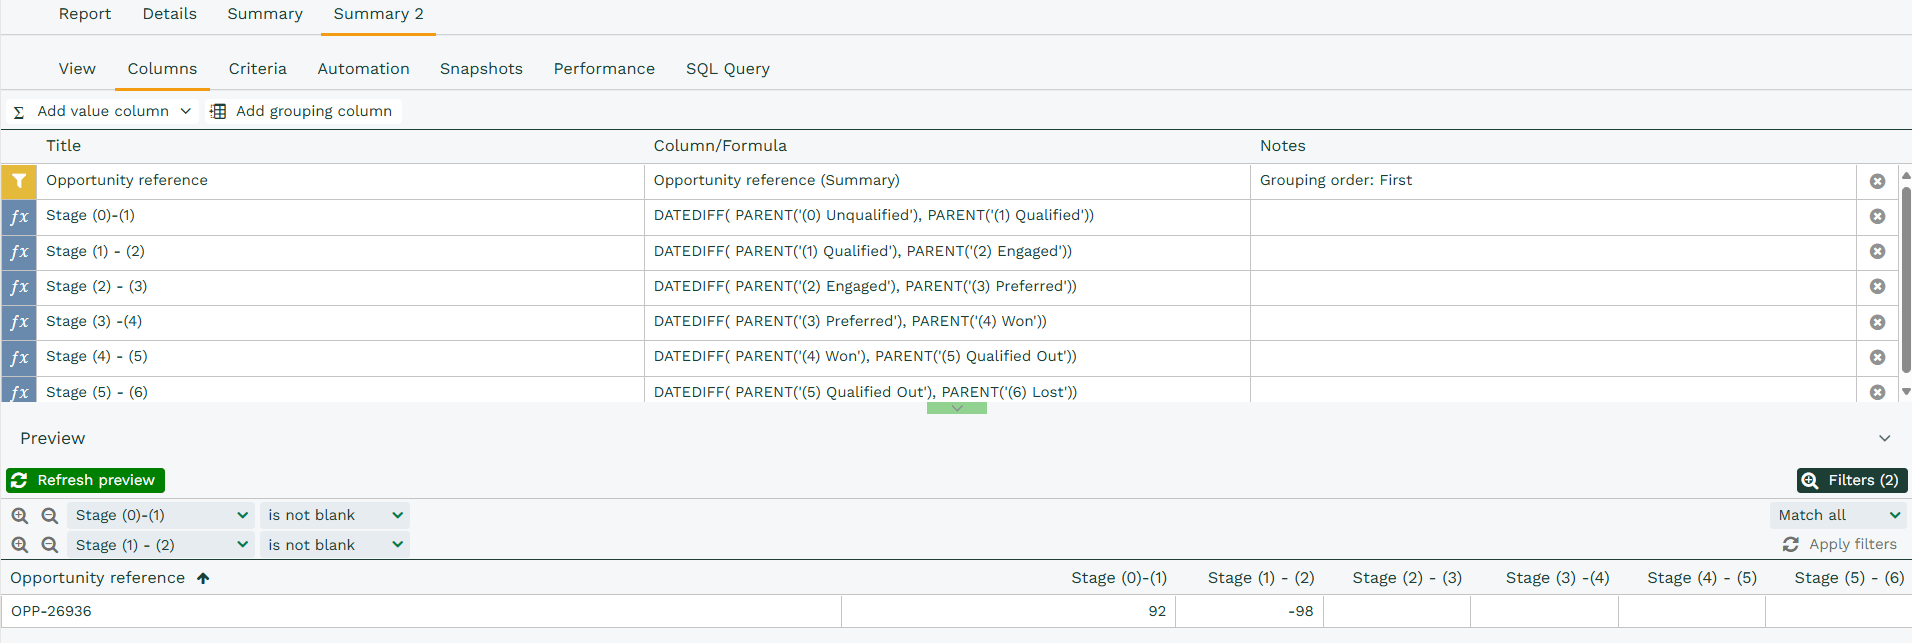
You’ll then be left with data like the example below for OPP-26936.
Things to note
- Opportunities may skip Stages, for example going from Stage 1 straight to Stage 3. In that case, there may be missing values, as shown in the screenshot above.
- Your database may be set up so that Opportunities can move backward through Stages and then forward again, rather than following a straight line from Stage 1 to Stage 2 to Stage 3. If Opportunities do move backward, you might see negative values in your report, as shown above.
It’s important to keep these points in mind when deciding how useful this kind of report is for your organization.