


Calendar Views
Workbooks includes the ability to view a Landing Page or Report in the form of a calendar, provided that the particular record type contains a field with a date/time datatype
Sometimes it makes sense to see your records in the context of a calendar rather than a grid. Activities are frequently displayed as a calendar, showing their Due Date or, in the case of Meetings, their Start and End Dates, but Workbooks allows you to display any Landing Page or Report as a calendar view, providing that the Landing Page or Report contains at least one date or datetime column. For example, Opportunities have a Close Date field, Transaction Records have a Document Date field, Campaigns have Start and End date fields, and so on. You can also add your own custom date/datetime fields.
The ‘My Activities’ Landing Page is the only Landing Page that will open as a calendar by default, whereby showing the records’ Due Date or, in the case of Meetings, their Start and End Dates.
When using a Calendar view you can:
- display a month at a time (as shown in the screenshot below) or change the display to a week or just a day.
- apply filters to limit the records shown in the calendar (just as you would in a grid view).
- arrange the records in the calendar based on any of the date/datetime fields in your grid.
- categorise the display by a field of your choice so that, for example, different activity types show in different colours, or records assigned to different users show in different colours.
- display a date range as a bar spanning the relevant days. This only applies when displaying a report as a calendar, except for the activities Landing Pages, which automatically show meeting start and end dates as a span.
- choose which fields display on the calendar for each record.
Note
To display a report as a calendar, showing a date range, the date/datetime field used must be displayed in its default way. If you've amended the date field using the advanced settings in reporting, the calendar view will not work correctly.
Switching to Calendar View
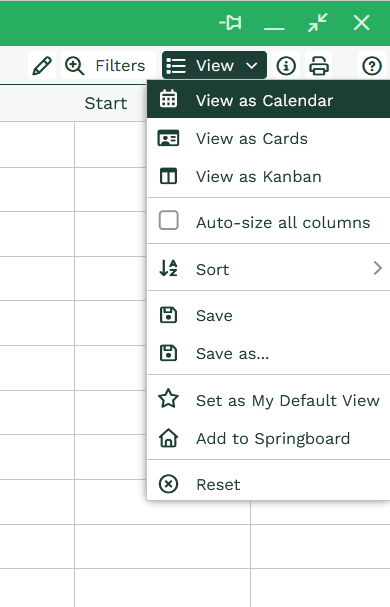
Switching from a grid view to the calendar view is easy. Click View on the top right of the Landing Page or Report then select View as Calendar.
Using Calendar View
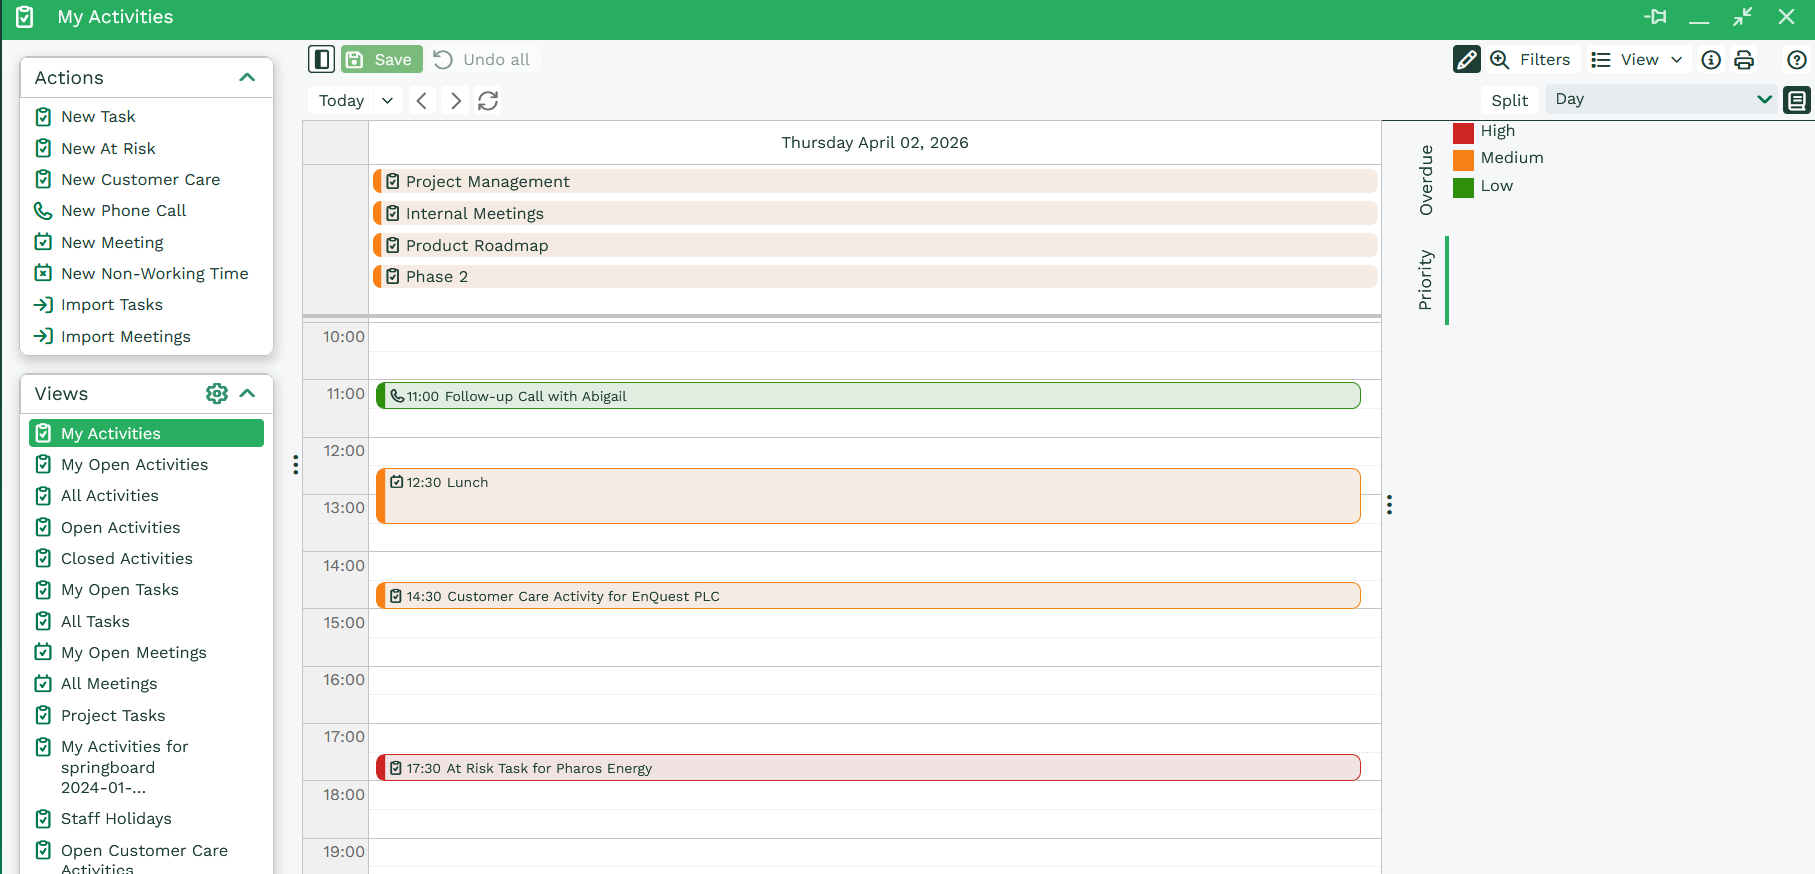
Calendar View has some distinct sections that differentiate it from other views. Besides visually being much more illustrative than the Grid view, there are some functional differences that you should be aware of when using it. The Calendar View can be broadly split into three sections:
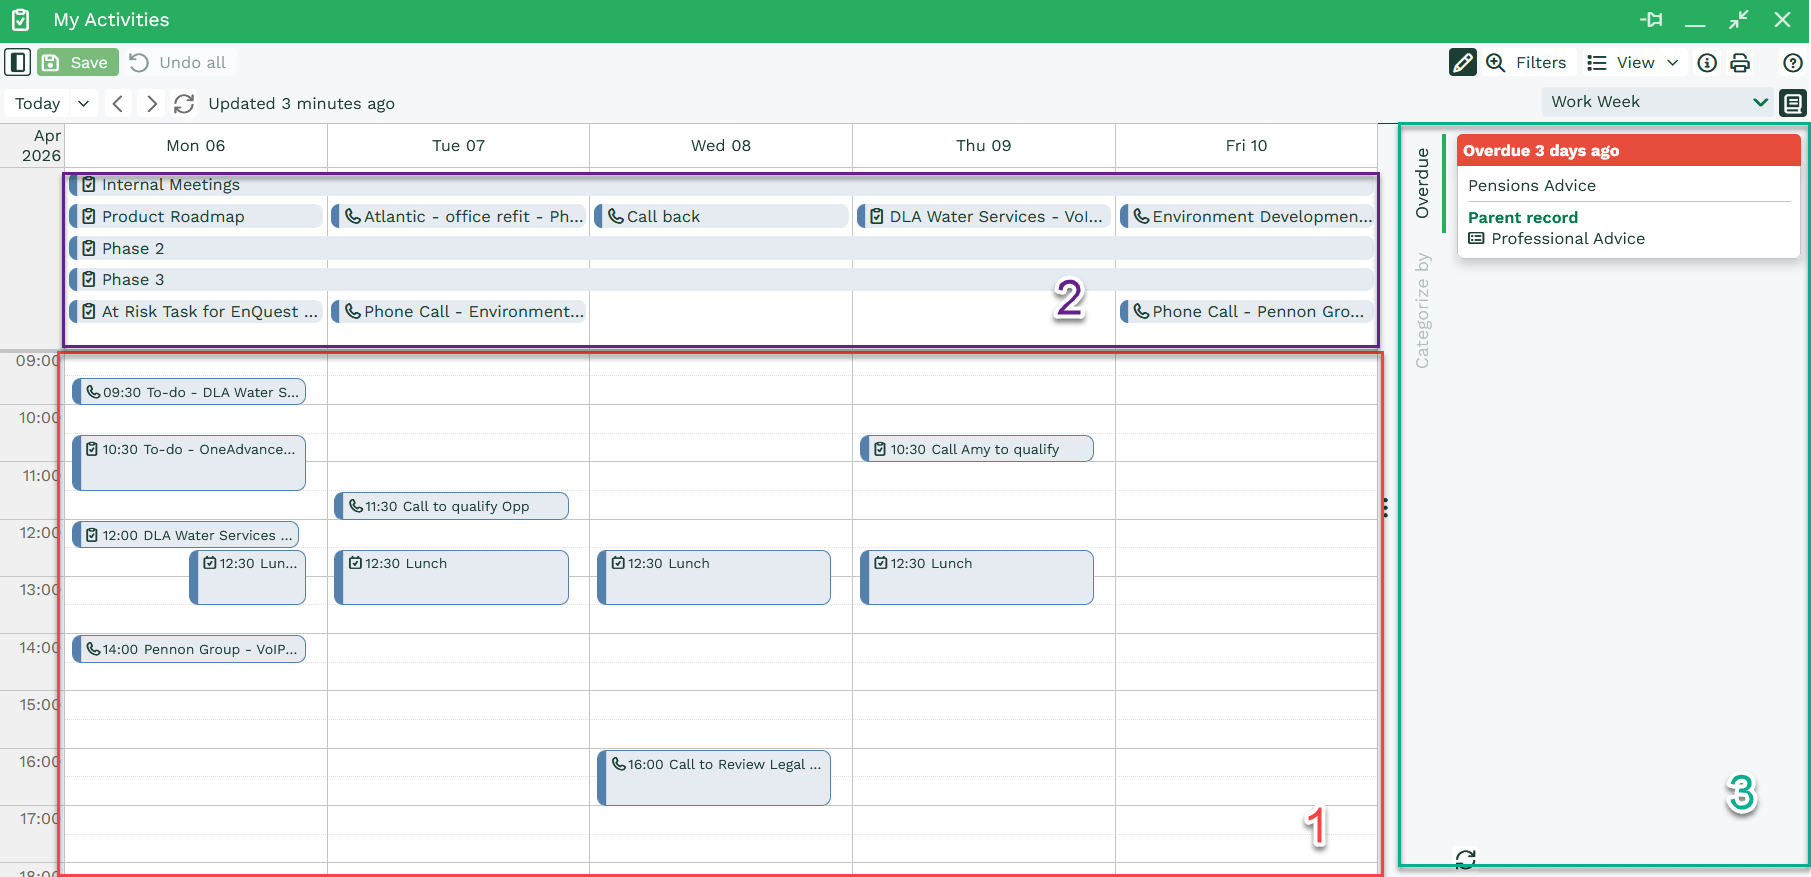
- The Calendar Grid – Here your Activities are time located based on a field of your choosing. When arranging the View by ‘Schedule’, your Activities will stretch the time between their ‘Start’ and ‘Finish’ values.
- Unscheduled – The banner across the top of the grid holds those Activities that are ‘Due’ on that day, but at present do no have a designated ‘Start’ or ‘Finish’ date/time. These can be quickly arranged when using Edit mode.
- Backlog – The side panel contains those Activities that are either ‘behind schedule’ (incomplete with a Due Date in the future but a start/end date in the past) or ‘overdue’ (have a Due Date in the past but have not been completed). When using the ‘Categorise’ functionality this panel tabs to accommodate the category options.
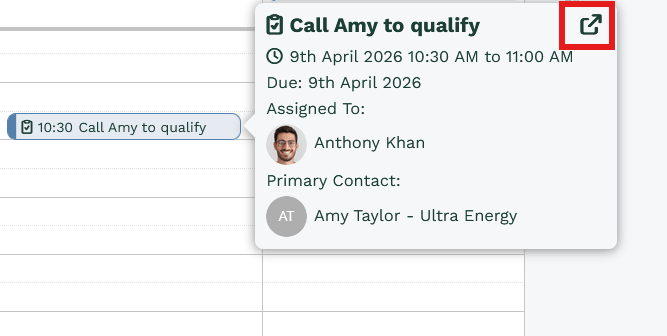
Mousing over an Activity in the Calendar will reveal additional information from the underlying record. The information that is presented can be customised and fields can be added or removed depending on user preference. To open a record from the Calendar, click on the icon in the top right on the information box.
Note
It's not only the Activity that can be opened from here. Other linked records can be opened, for example clicking onto Anthony Khan's name will open his Person record.
New Activities can also be made within Calendar View via edit mode. To initiate edit mode, simply press the pencil icon in the top right of the window:
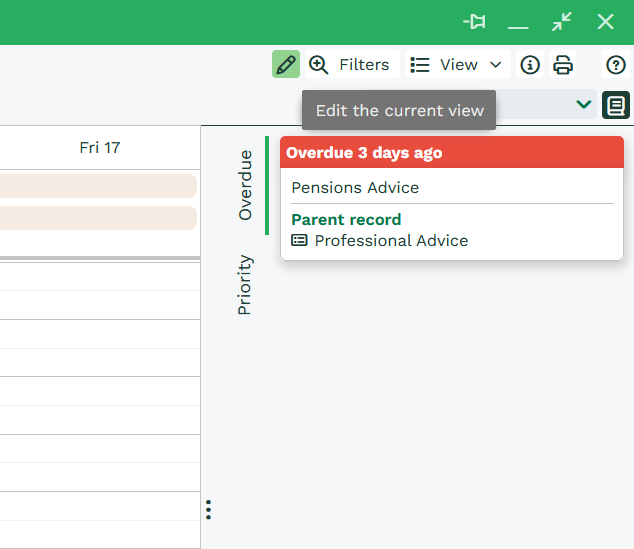
Whilst in edit mode, click/drag within the Calendar to designate a time for the new Activity. Once a time has been specified, select the type of Activity you wish to create via the small menu that appears and a new record will open with the Start/End date specified prefilled in, ready for the input of all other necessary data.
Adjusting your Calendar View
Calendar View has a number of range options that allow you to access the records that you want:
- Day – view the current day
- Work Week – view the week Monday through Friday
- Week – view the week Monday through Sunday
- Month – View the entire month
The view can be switched between these options using the drop down at the top right of the window. You can set the calendar view as your default, or save it and give it a name so that it appears in your list of views in the left-hand column, just as you can with any Landing Page view.
In the Month view of a calendar, records will show in ascending order based on the field that you select to arrange/categorise your view by, so 9am will show before 3pm.
Within the Week or Day view, you will see an hour by hour breakdown of your records. This is particularly useful when arranging meetings, as the view allows you to see your availability quickly.
You can page forward to the next day, week or month by clicking the right arrow at the top of the page. It is also possible to select the date you wish to view using the date picker. Either way, the calendar will display in whichever mode you have selected on the top right of the Landing Page
Note
Today's date will be highlighted. Workbooks will give that day's date and the current time. The time will update automatically.
Customising your Calendar View
A calendar can be set as the default view for a Landing Page just as you can for a grid view. This means that when you open a Landing Page, you will see a calendar view of your records without having to switch to it manually each time. For more information on how to do this, see here.
You are able to customise the records that are shown on the calendar by adding a filter in the same way as you can for a grid view. For example, you may not be interested in Activity records that are assigned to a particular user. Using the filtering functionality, you can omit these results from your calendar view.
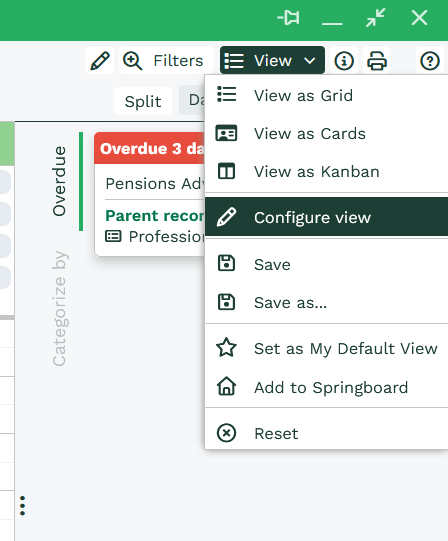
Configuring the Calendar View
The Calendar View can be further customised via the ‘Configure View’ menu. To access the Menu, navigate to the ‘View‘ dropdown menu at the top right of the page and select ‘Configure View‘
Within the configuration menu, there are three available settings for modification:
- Arrange by
- Categorise by
- Columns to display
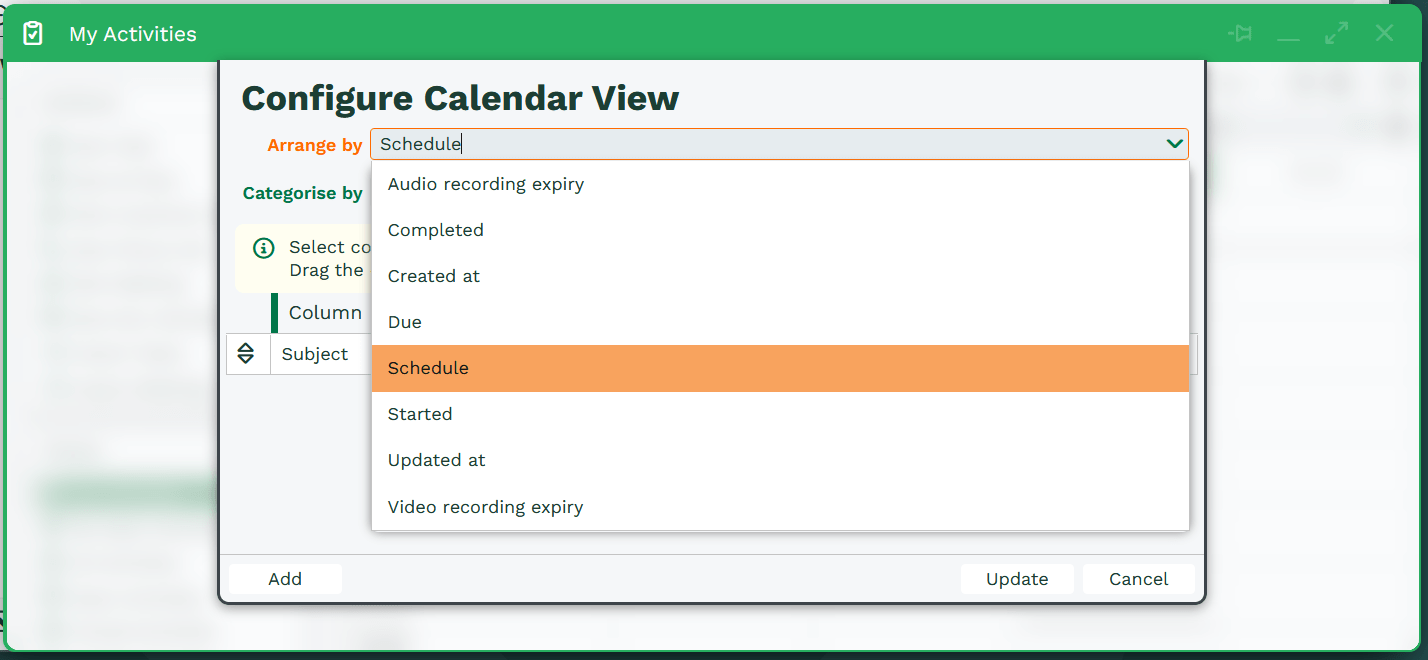
Arranging your Calendar
The calendar view allows you to arrange your records by a date/time field. This list will change depending on the record type you are working with. For example, when looking at the Activities Landing Page you can arrange records by their Due Date whereas if you were working with Opportunities, Due Date is not present on this record, thus is not available. You could however arrange your view by the Close Date when looking at Opportunities.
If your records include Custom Fields with a data type of Date or Date & Time, you will be able to arrange the calendar based on these fields too.
Categorising your Calendar
To make it easier to differentiate between records on your calendar, you can colour code (categorise) them, based on any field on that record type with a data type of Picklist.
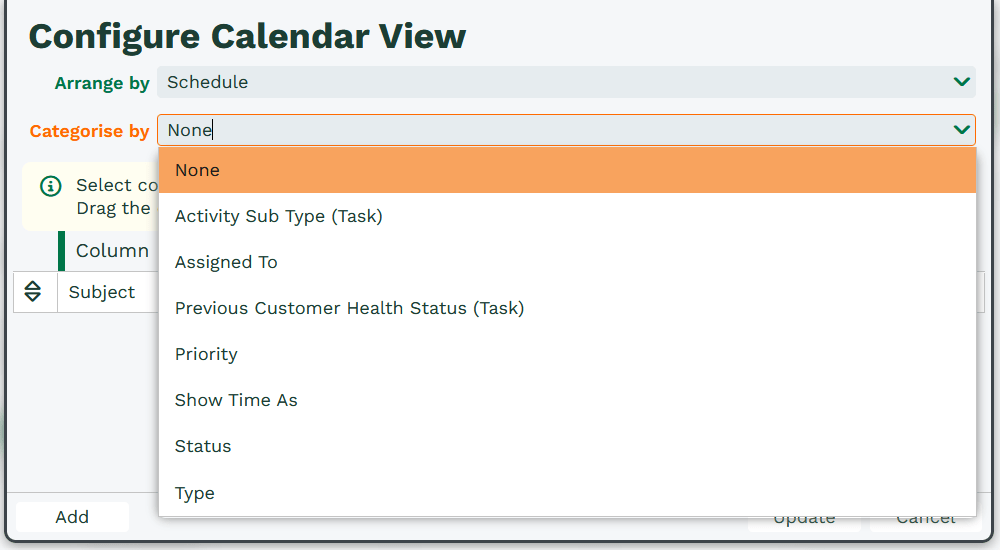
Selecting a field to categorise your calendar by, automatically assigns a colour to every record with that value. By default there is a colour legend that appears in the side panel to the right of the calendar view to identify the meaning of each colour. For example, selecting ‘Priority‘, will assign a colour to all records of a particular Priority.
This can vary from database to database and may not necessarily be the same colour each time. Clicking a particular category in the colour legend will filter out that category from the Calendar. You can add them back in by clicking the same category again.
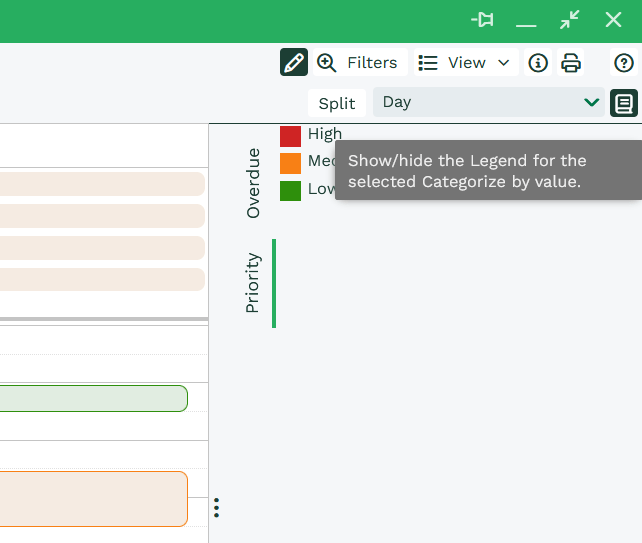
Note
You can hide the Backlog/Category side panel by pressing the book icon in the top right of the window
Note
When you select a new field to arrange your view by, or to categorise your records by, Workbooks dynamically updates the calendar view and does not require you to reload the page.
Choosing which fields to display on a calendar entry
You can choose to display any values from fields in your underlying record. For example, on an Activity Landing Page you might choose to display Status or Priority and on an Opportunity you might like to display, say, the Stage, Close Date and Amount. If you’ve generated your calendar from a Report rather than a Landing Page, you can only display values from the columns in your Report.
The fields displayed are controlled by the grid at the bottom of the configuration window. To add a new field, simply press the ‘Add’ button at the bottom left. This will present you with a new row in the grid which gives you the option to select which field you want to display. The fields are displayed in the order in which they appear in the grid. To change the order in which the fields appear, drag and drop the relevant field into the desired positioning
When you’ve added all the fields you want to see, click Update. When your calendar is displayed as a month view, you’ll see the text values you added when you hover over the calendar entry. If you change the calendar to a Day or Week view, the information you added will be visible. Remember, if any of the records on the calendar view do not have a value for one or more of the fields you’ve added as display text, nothing will appear so some calendar entries might ‘appear’ to have less information on them than others.
'Schedule View' (how to schedule your Activities)
By default, unless another view has been saved, the Activities Landing Page will open in ‘Schedule View’. If you have a View saved and would like to switch to Schedule View, simply navigate to the ‘Configure View’ menu and set ‘Arrange by’ to ‘Schedule’. Schedule View opens in edit mode and allows you to quickly and easily create, schedule and reschedule Activities from a combined view.
Take the below example in which a User has a number of a number of Activities due this week, but are yet to be scheduled.
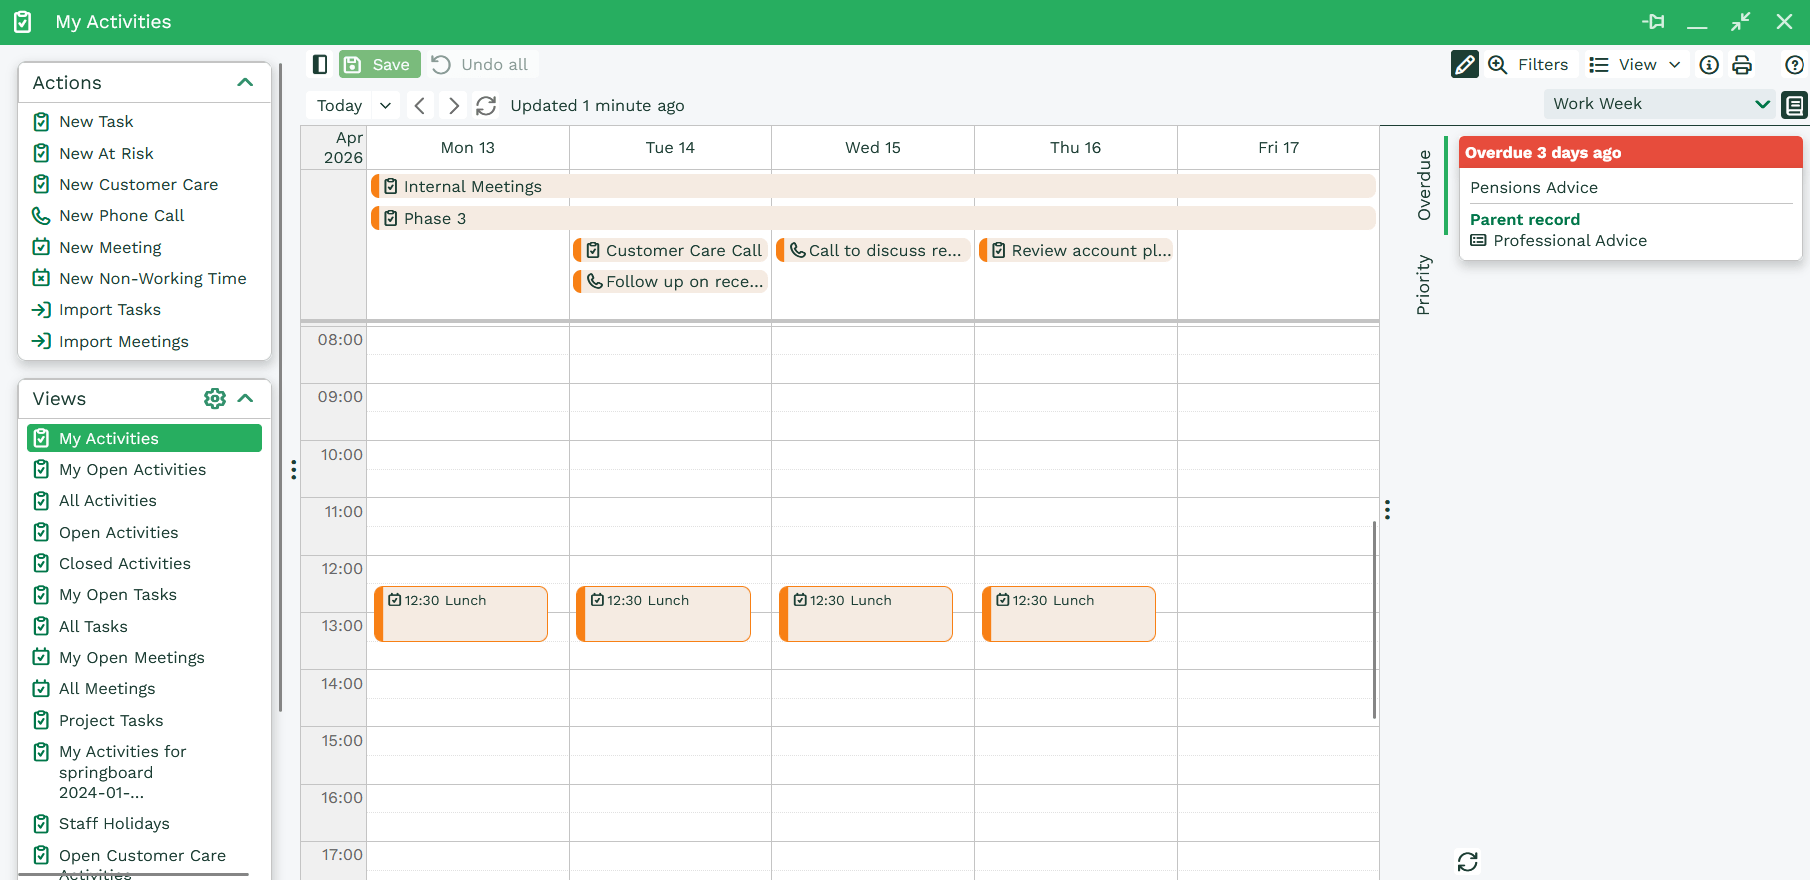
Schedule View allows you to quickly set dates or times in which Activities can take place through drag and drop. Simply ensure the View is in edit mode and drag a Task or Meeting into a time slot on the Calendar. Activities can be moved between dates but be aware that this will change the Due Date on the underlying record. Ensure that you save the changes you’ve made to make them permanent.
Schedule View also allows you to change the duration of Activities via extending or contracting the amount of time they cover in the Calendar.

If at any point you wish to undo the changes you’ve made, simply press ‘undo all’ in the top left corner of the window.
Display date ranges on Calendars
When you have a record that includes more than one date/datetime field, it can be useful to see the ‘from’ and ‘to’ dates displayed on a calendar as a horizontal bar, spanning the appropriate date range. You can achieve this in Workbooks by creating a report that includes the dates, pairing the dates and displaying the report as a calendar view. The video at the foot of the page describes how to do this and written instructions are below.
For this example, imagine you want to display your Marketing Campaigns on a calendar showing how long each one spans, so you can easily see any overlapping dates. You want to generate something similar to this:
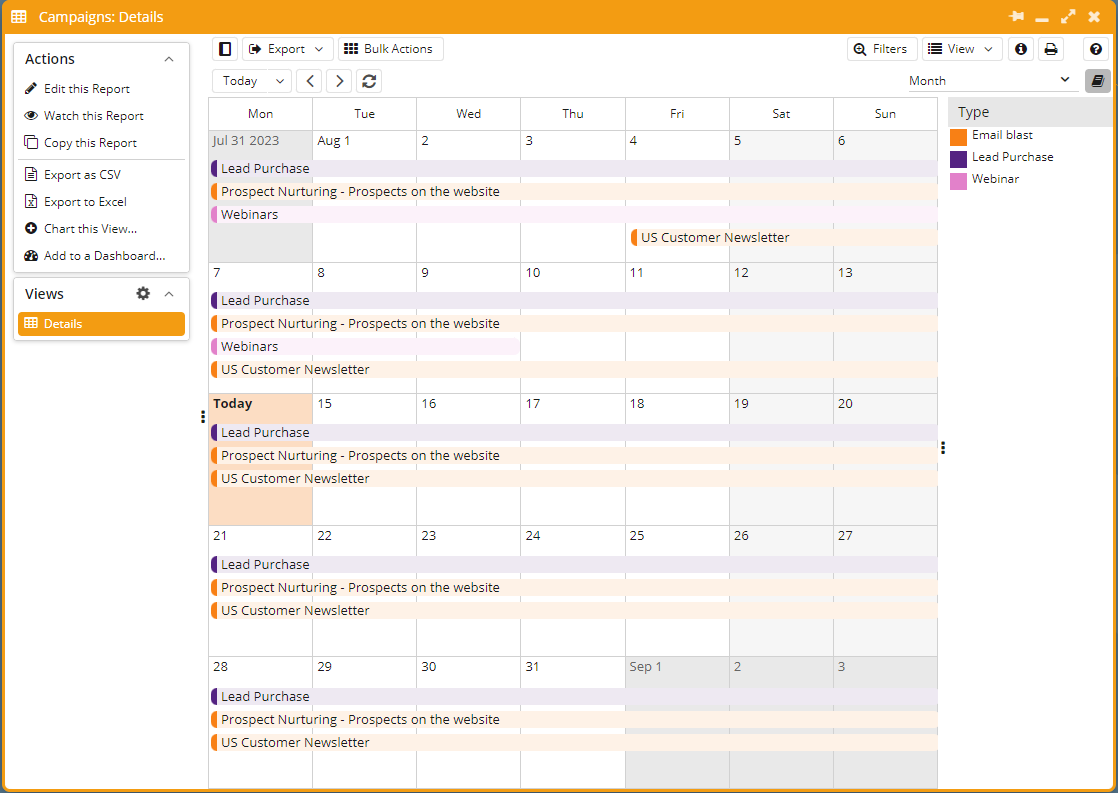
Marketing Campaigns already include Start and End date fields but if the records you want to display don’t, you could add custom fields to achieve the same outcome as long as you’ve created either date or datetime fields.
Create a report that includes columns for the dates you want to pair. In this example it’s the Start and End date fields. Open the Start date column and then the Advanced tab. In the End range column field select End date. The picklist here will only ever show columns in your report that are date or datetime fields. You don’t need to do the same thing with the End date field as Workbooks will automatically join the two together now that you’ve specified the End range column for the Start date. Save & Close the Start date column and Save & Run your report. Use the View button in the top right to select View as Calendar. You’ll now see the relevant records with a horizontal bar representing the two dates you paired. You can pair more than one set of dates in a report but you can only ever pair one date with one other, not with multiple others.