


Reporting on Opportunity Stages
This page will show you how to look at the time taken between each stage of your Opportunities
The report can be useful for identifying certain areas in your sales process that may be causing a bottleneck, as well as providing you with an insight of where your sales resources should be allocated.
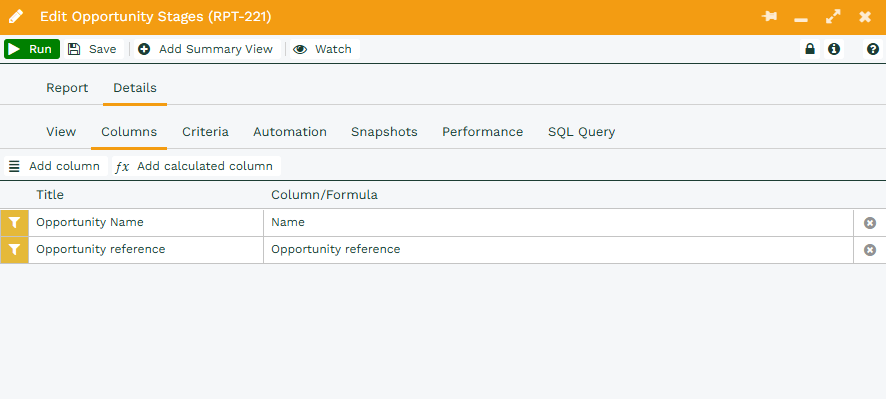
To start with, we will need to create an Opportunity report, and add columns for Object Reference and Opportunity Name. It is important that we use the Object Reference to avoid confusion between duplicate records.
Next, add calculated Columns for each Stage. These will look into the Audit records, to identify when new values were assigned to Opportunity data. For the first (see below), we are only looking for Opportunity changes that relate to Stage 1 – which in this example is (0)-Unqualified, so we have in the formula: LIKE “%0” to only retrieve related info, for Stage 2, which in our example is (1) -Qualified, we would adapt this to: LIKE “%2”, and so on.
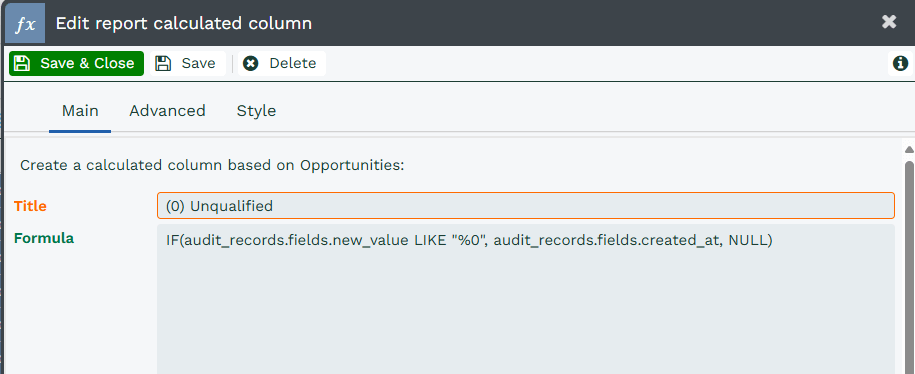
If you wish to copy and paste this formula, then you can: : IF(audit_records.fields.new_value LIKE “% [enter your stage number here] %”, audit_records.fields.created_at, NULL)
Once this has been completed for all of your Stages, you will see a screen similar to the below
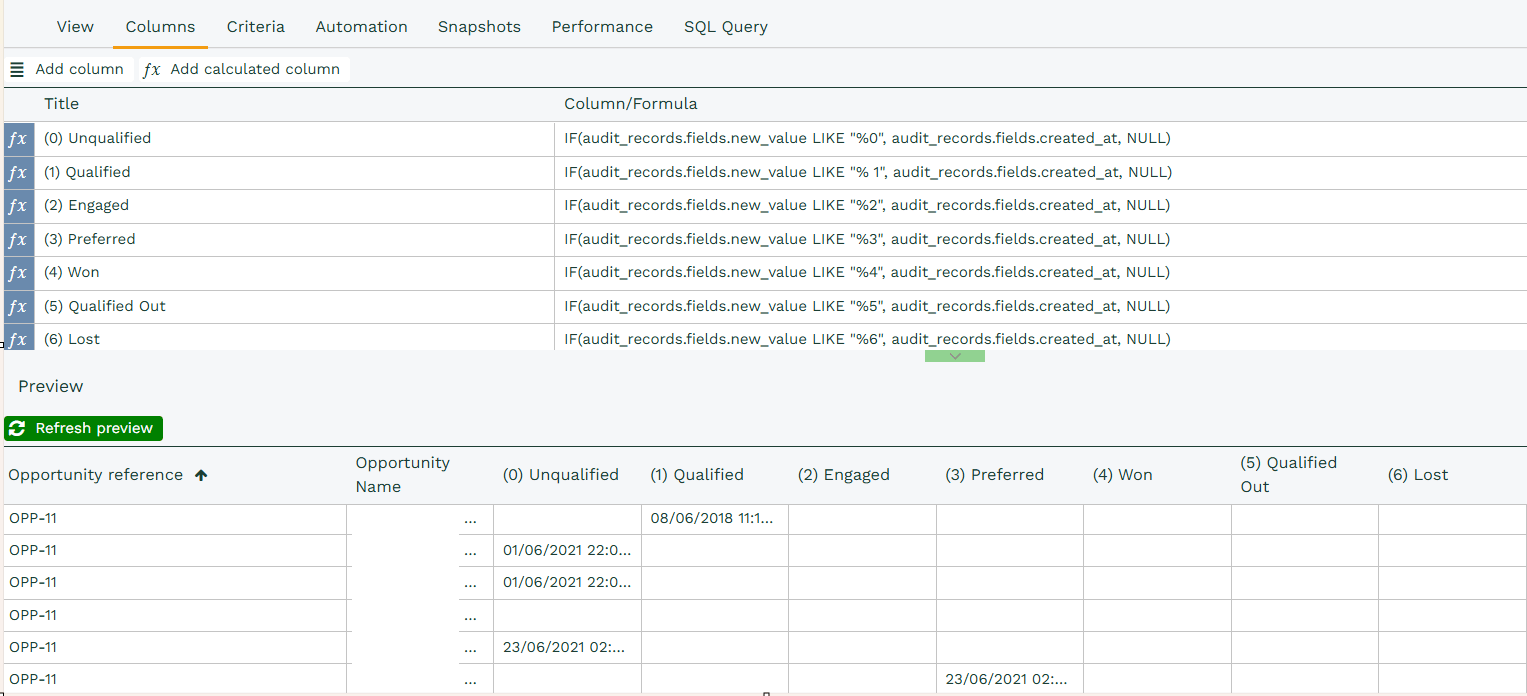
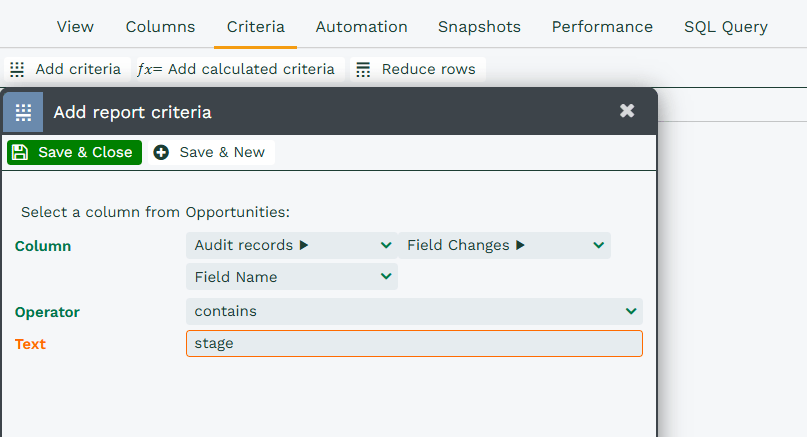
You will notice that the data is not filtered to Stages specifically, and so in order to make this report look at relevant records only, we then need to add criteria that narrows our view down to Audit records relating to Stages Only.
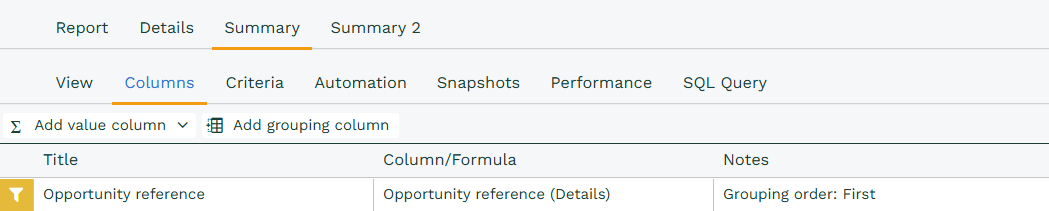
Now we need to add a Summary View, and the first column that needs to go here is a grouping column, which is going to group by the Object Reference of the Opportunity.
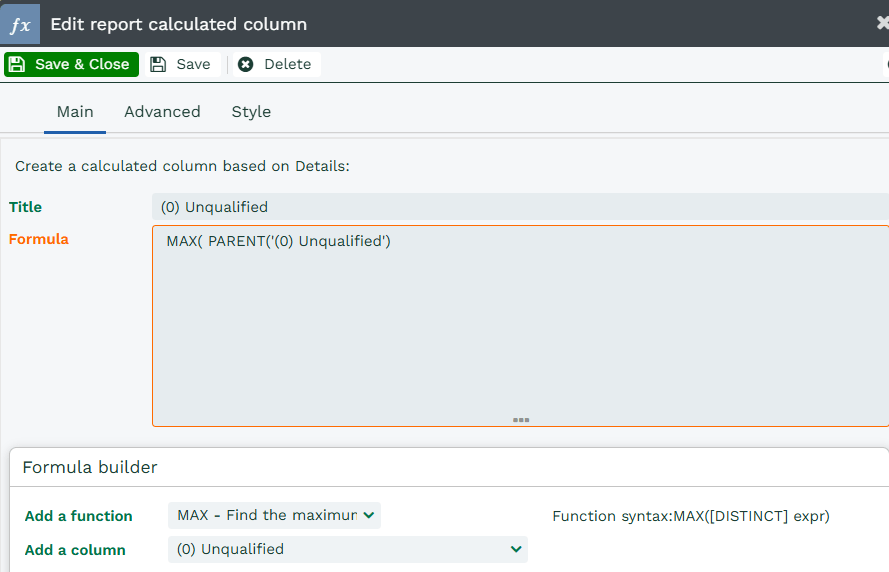
To ensure that we are only looking at the most recent records for these field changes ( since Opportunities can move forwards and backwards in their stages, we only want the most recent records), we need to add columns to the Summary Views; telling Workbooks to only find the most recent date for each Stage, using the Formula below:
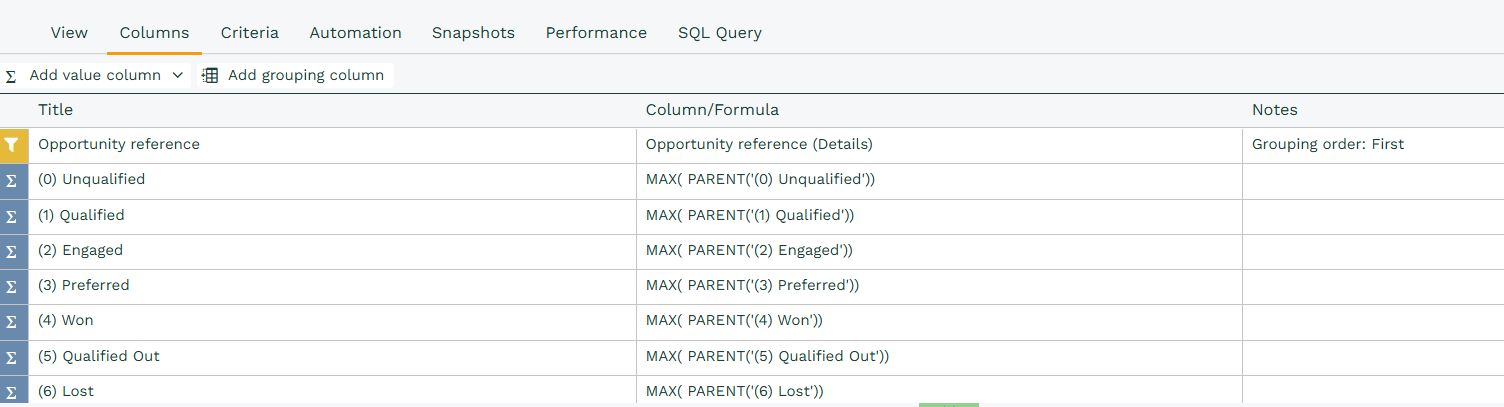
Once this has been completed for each stage, your screen should look like the below.
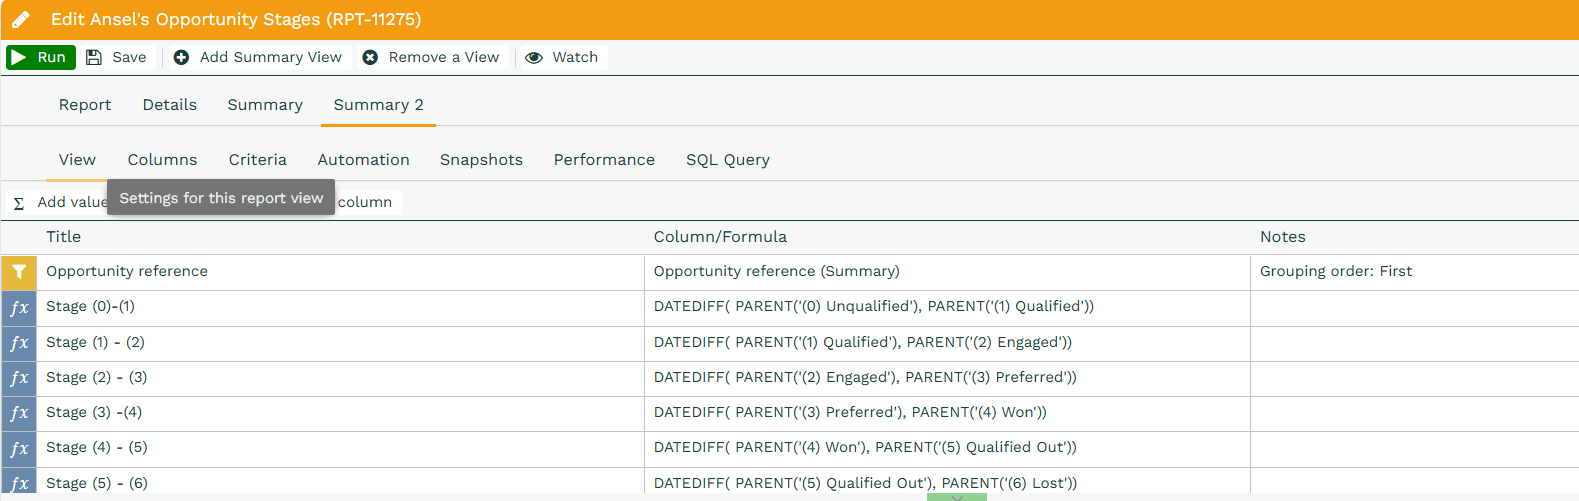
Now, in order to see the time in days between each Opportunity Stage, we simply need to use the DATEDIFF function, to work out the differences between the date values we have collected and we will do this in another Summary View.
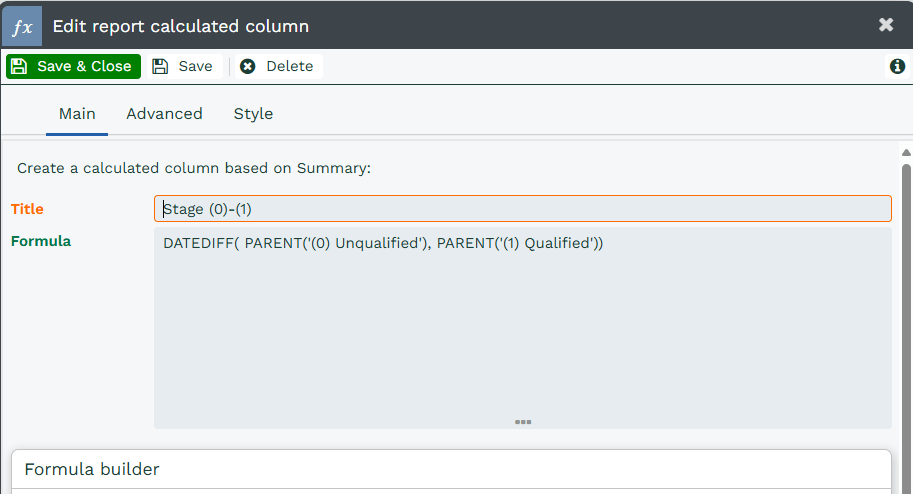
Once this has been completed for all Stages, your screen will look like the below
Once this has been completed for all Stages, you will be left with the below data, for example, OPP-26936
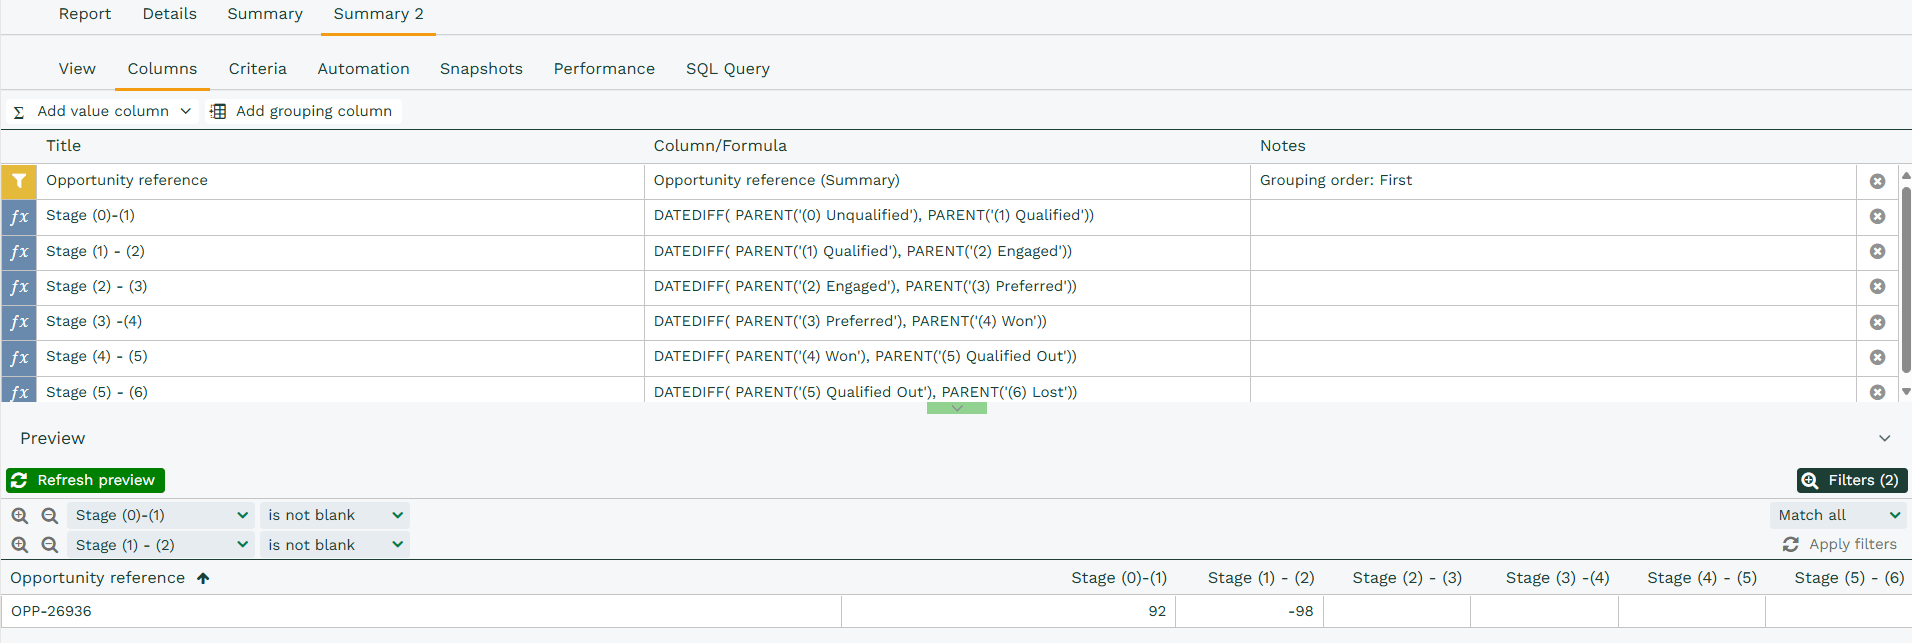
To Note:
1) Opportunities may ‘jump’ stages, e.g from Stage 1, straight to Stage 3. In that scenario, there may be missing values as shown in the screenshot.
2) Your Database may be set up so that Opportunities can move backwards through Stages and then forwards again rather than following a linear, Stage 1 to Stage 2 to Stage 3. If Opportunities do move backwards, you might see negatives in your report, as shown above.
It’s important to consider the implications of the above points when considering the effectiveness of this sort of report within your organisation.