October 2021 Release
Release date: 16th October 2021
This release focuses on making Workbooks easier to use and navigate around, including:
- A new personal collection of dashboards called a Springboard.
- Dashboard improvements, including a new look and feel as well as new functions.
- Viewing Reports and Landing pages as Cards.
- Displaying Tabs in a Side Panel on your records.
- New Target Records for your reports.
WORKBOOKS IS REBRANDING!!
Over the last few days, you’ll have seen that our website has been updated with our new branding! You see some changes in Workbooks too – more will appear over time but right now there will be a refreshed login page, and you will see our new logo in the Start Menu button. Our new branding emphasises Workbooks’ customer-centric focus, delivering a CRM platform that is personalised and fine-tuned by our own experts precisely to your business goals.
Springboards
An exciting new feature is being added to help you manage your day, called “My Springboard”. This is a sort of ‘homepage’ to help you drive your working day and consists of multiple Dashboards in one easy-to-use place.
You’ll only see your Springboard once you or your System Admin has added a Dashboard to it. Once that’s been done, you’ll see it as soon as you login. We love the way it enables you to see what you need to do each day as well as your progress against target.
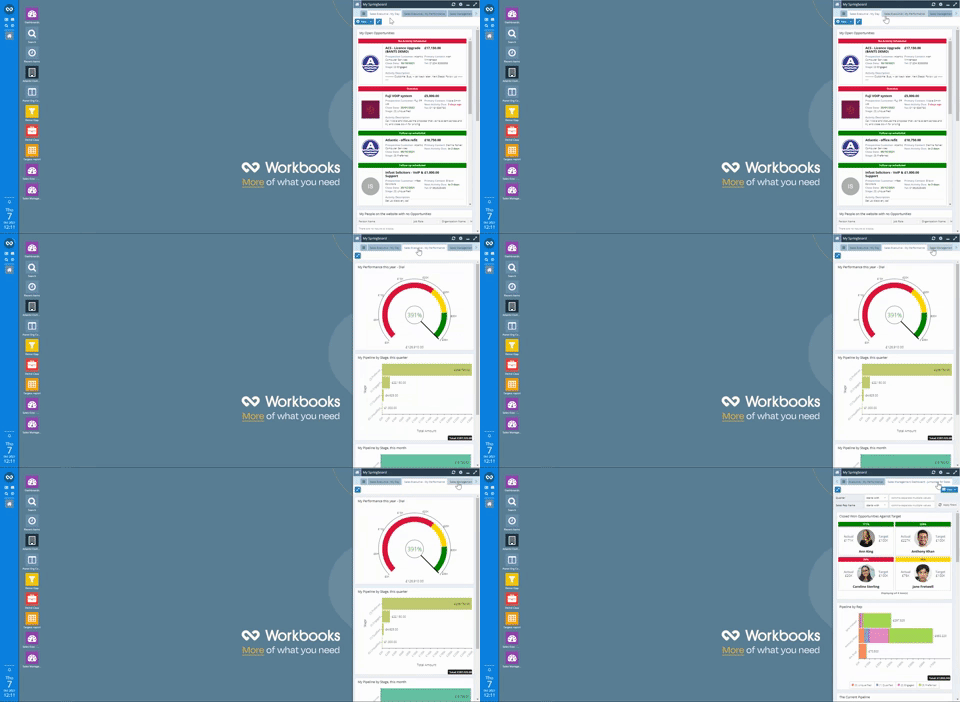
Check out how to manage your Springboard on our Knowledge Base.
Dashboard Improvements
Dashboards have been given a facelift and are now crisper and easier to use. We’ve changed the blue title bar of each report window to a cleaner white header, and hidden the Refresh and Open buttons until you roll over the window.
More exciting than that though is the ability to add a ‘New’ button to your Dashboards, or to a report window within the Dashboard. You’ll be able to create new Records (of any type) from the Dashboard instead of navigating to Start > New or to a Landing Page.
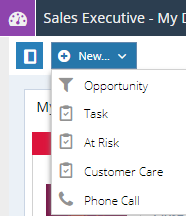
Other enhancements to Dashboards include:
- Landing Page Views can now be added to Dashboards.
- ‘Dashboard’ now appears in the Start > New menu.
- When adding new reports or charts to a Dashboard, they’ll be added to the bottom instead of at the top
- Dashboards will be responsive when resizing the window, collapsing into one column when made too narrow.
- When editing Dashboards to reorder the reports and charts, the windows will shrink down to just the Title bar, to make it easier to see the full layout as you move the windows.
- The ‘Category’ field has been added to make it easier to organise and find Dashboards.
- A ‘Description’ field has been added to Dashboards, and to the reports and charts that are added to the Dashboards, which is visible when hovering over the new info button on the report window.
Card Views
To make it easier to see all the relevant information without having to scroll to the right, there’s a new way to view your Reports and Landing Pages! As well as the standard ‘View as Grid’ and ‘View as Calendar’ options, we now offer a ‘View as Cards’ option. There are multiple Card Templates to choose from: with images, banners, and different layouts, you can configure them to show the fields relevant to you. On reports, you can even pull through the styling.
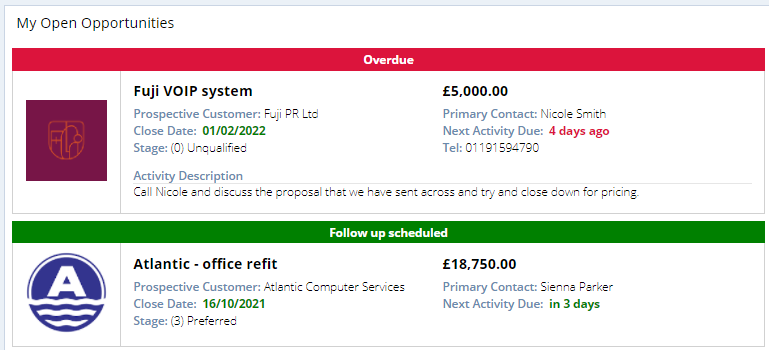
Note, this is only available on some Record Types; you can find more information on Card Views on our Knowledge Base.
Side Panel
Form Layouts can often get cluttered with the amount of information that you want to see, or it can take a few clicks to get to the information you need. So we have introduced a new feature called the Side Panel. The Side Panel lets you display a tab of your choice to the side of the form.
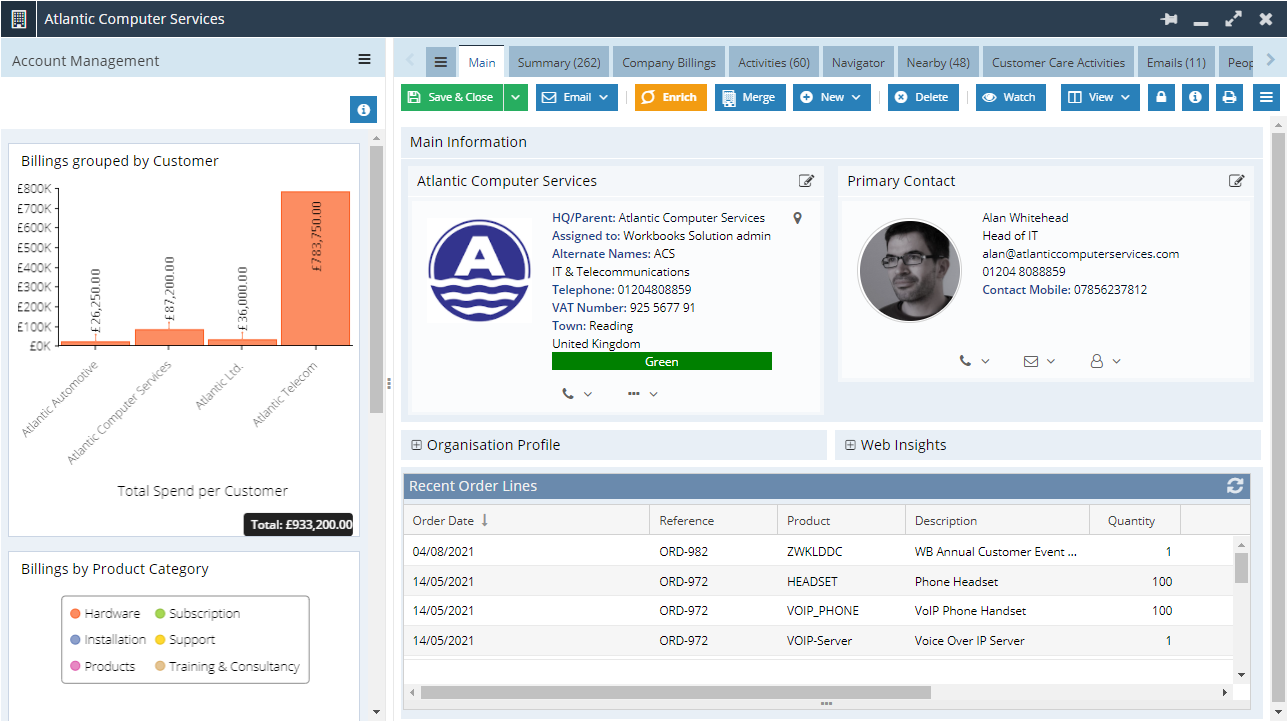
In combination with the new Card View, you could display the People in the Side Panel of Organisations, or you could even display a Dashboard tab. You can find out how to set these up on our Knowledge Base.
Overview Tab
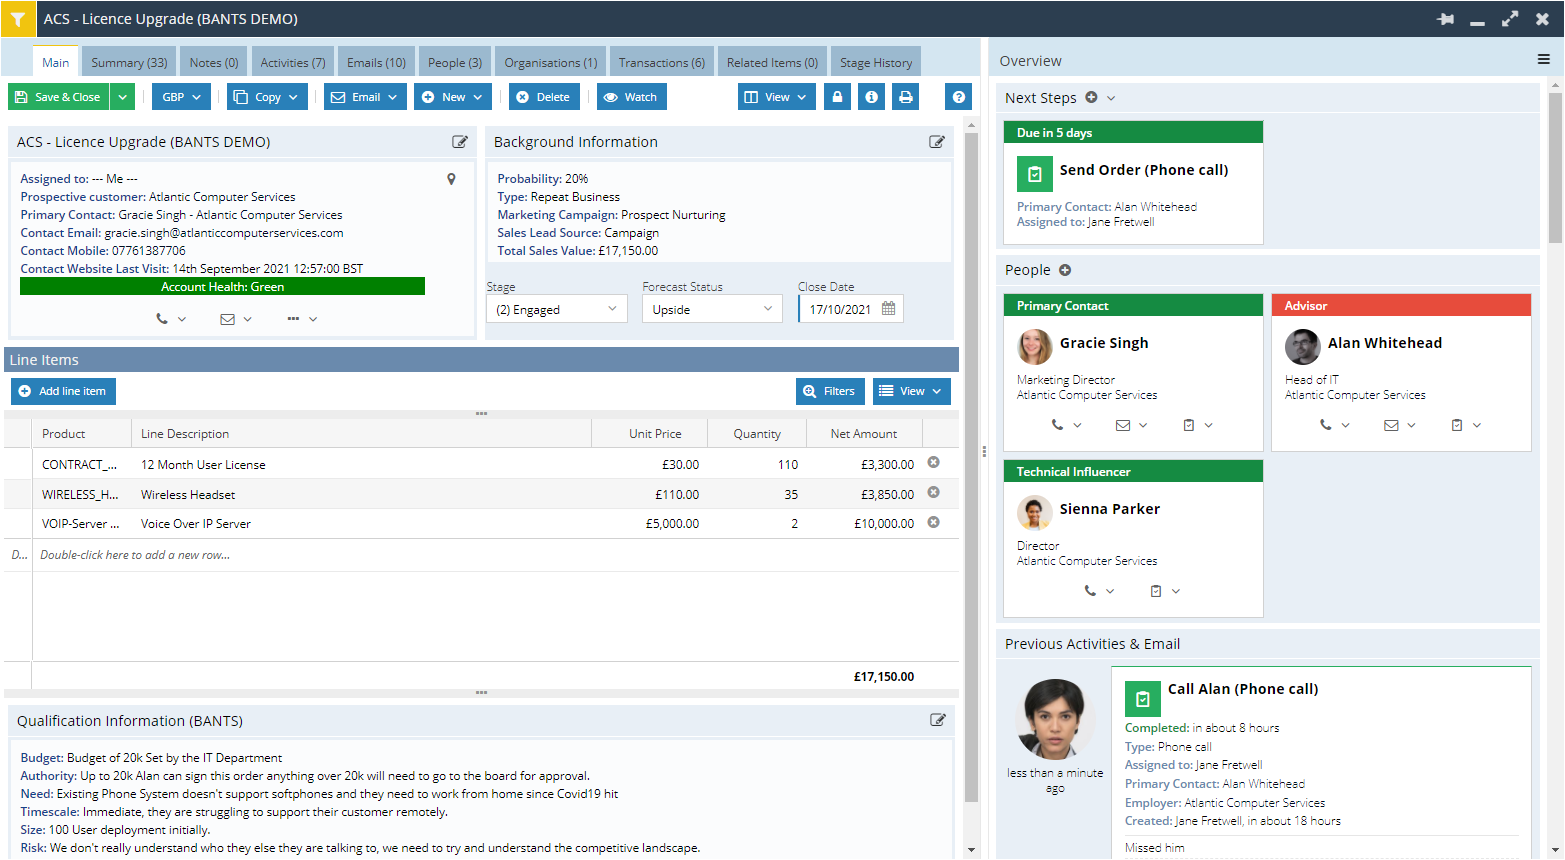
A new tab is available on Opportunities and Cases, called the Overview. The tab brings together your Activities, Emails and Related People into one view, and especially when used in the new Side Panel, can help you drive your workflows: quickly check your next steps, create new Activities, manage the related People and access their contact details, and see what emails or tasks have already happened. For more information on the Overview tab and a video of how to use it, see our Knowledge Base.
Targets
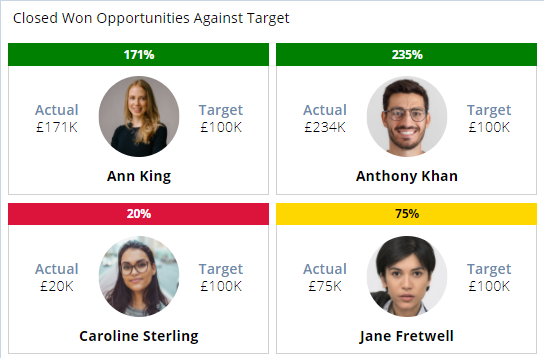
It can currently be a time-consuming task to add and update targets across your reports. Our new Target records will not only make it easier to store targets in the system, but also reduce the admin to roll them out across your reports.
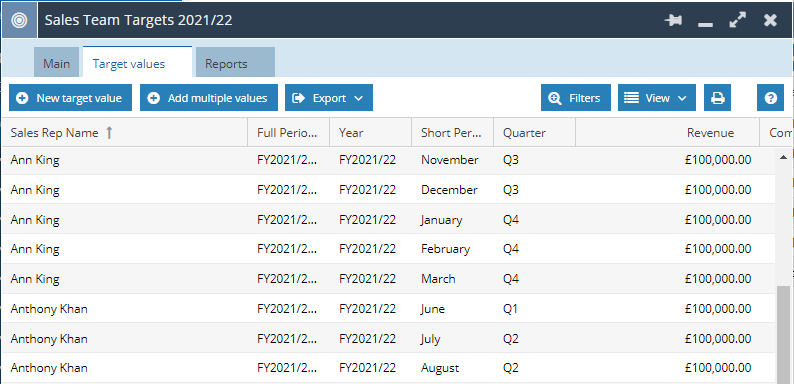
One of the key benefits of the new Targets is that they will cause a row to show even if there is no data for it, like Caroline Sterling here who has no Opportunities and therefore her ‘Actual’ is blank:

You can find more details on our Knowledge Base.
Date Picker
There’s a new dropdown option on the Date fields on Activities, which allows you to select the date using a number of days, weeks or months. This makes it faster to set a date without having to scroll through the calendar or manually type in a date, though these options will still be available.
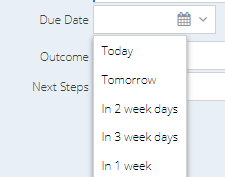
It will also be possible for you to configure your own picklist for other Date fields in your system. For example, you may want to add it to the Close Date field on Opportunities to make it easier to set the date for “in 3 months”. You can find out how to configure this on our Knowledge Base.
Reporting and Charts
-
Save & New
A nice little thing for those that build reports often – when adding new columns to reports, Workbooks will now remember your previous selection when you click ‘Save and New’, meaning you won’t have to select all of the same drill throughs all over again.
-
Converting Currencies
A useful function has been added for our customers that work in multiple currencies. This function will allow you to convert one currency to another, based on the exchange rate on the relevant date. Find out how to use this function on our Knowledge Base.
-
Detecting empty fields
Those familiar to reporting will know that sometimes you need to test if a field is blank or null. We’ve created a new function to make this easier to do: find out more on our Knowledge Base.
-
Chart Settings
When editing Bar and Line Charts, you’ll see a new ‘Scale’ section in the settings. This allows you to control the values that your axis starts and ends on. This will make it easier to compare values when you are displaying similar charts side by side, and also make it easier to read charts with high starting values.
Also on Bar and Line Charts, you will see a new ‘Axis label orientation’ setting. This will be useful for charts with long label names that used to get cut off; you can now display the labels at an angle so that they all fit in the screen.
-
Mapping distance
More new functions, this time for those of you that use our mapping module. The new Map Position functions will allow you to find the distance between 2 map positions, in kilometres or miles. Find out more on our Knowledge Base.
-
Filters for calendar/accounting periods
You may spot the new operators that we’ve added to criteria, mainly ‘is a calendar period’ and ‘is an accounting period’. These allow you add criteria on date or accounting period fields that you have formatted, e.g. where you have output a date as just the month name, you can now add a criterion for ‘is the current calendar month name’.
Some other small changes…
- The Search window will now initially show your Recent Items, and it is now possible to Search within your Recent Items.
- The Accounting Period creation wizard has been restructured and includes additional validations to reduce errors.
- Bug Fix: Form Layouts should now work correctly for Mailing List Members/ Campaign Memberships / Event Attendees.