Creating a Pre-populated Report
An overview of how to create a Pre-populated report and what kind of information is contained on them.
Tip
Modifying an existing report is a quick way to create a series of similar but different reports without changing the original report.
Click on Refresh preview each time you add a column, criteria or summarise your data. This enables you to check your report is building correctly and ‘sense-check’ that it’s displaying the results in the way you require.
Pre-populated reports are useful for creating a report with a set of commonly used columns – it’s quicker than adding the columns manually. If any columns are not of interest, simply remove them from the report by clicking the red cross and equally you can add more columns if required.
Please note, by default, pre-populated reports don’t have any criteria, which means all records of that record type will be displayed. Add Criteria to limit the results to a particular set of records.
How to create a pre-populated Report
Click Start > New > Report > A new pre-populated report and select the record type on which you want to base your report.
1. Fill in the fields on the Main tab:
- Give the report a clear Name – Keep it simple yet accurate. This will ensure the report is easy to locate e.g. “Opportunities created this financial year”.
- Add a meaningful Description – This makes it easy for you and colleagues to understand the report’s purpose e.g. “List of opportunities created this financial year, showing their value and the gross margin”.
- Set a Category – The category field makes it easier to group and find reports based on their purposes. You can select from one of the pre-defined categories, or add/amend the categories picklist within Configuration.
- Click Save.
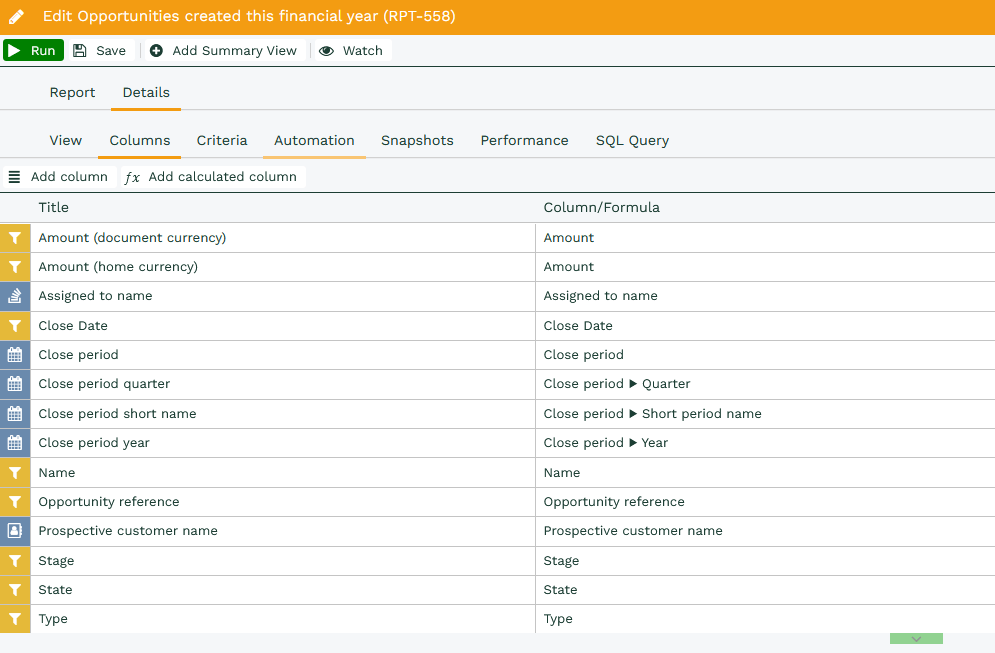
2. Details View > Columns Tab:
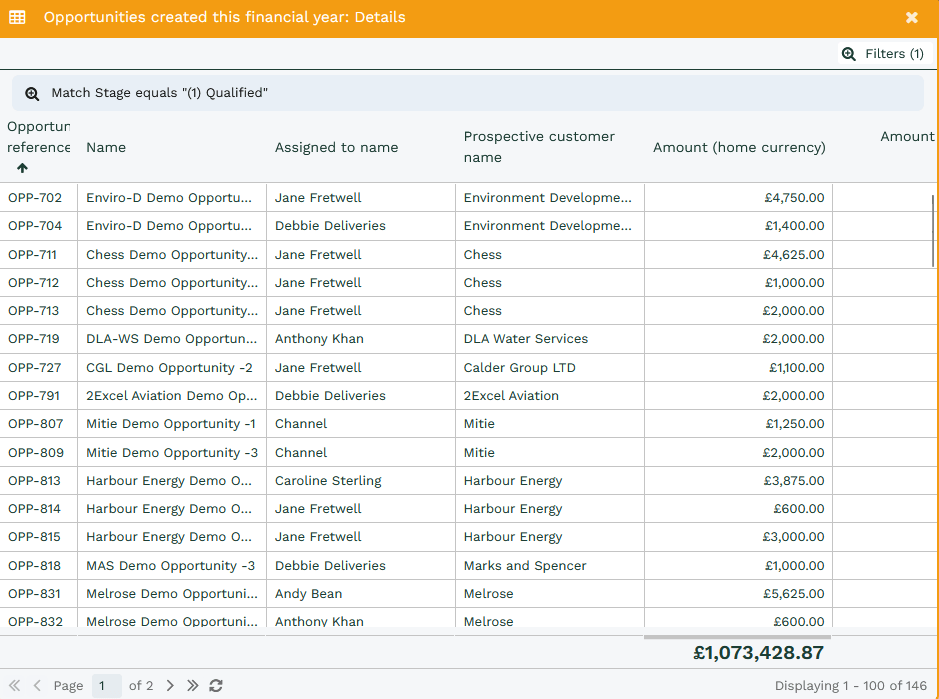
The Details tab displays a preview of the report. Workbooks automatically formats columns. For example, Amount is formatted as a currency and a total has been added at the bottom of the Amount column.
NOTE: The total shown is the total for ALL the rows in your report, not just the ones visible in the preview window. If your report contains more than 1,000 rows of data, the total won’t show automatically (and you’ll see the word ‘Calculate’ in greyed out letters, but you can make it appear simply by clicking on Calculate).
3. Details View > Criteria Tab:
You now have a report of all Opportunities on your database. You can sort, reorder or filter this information as you would with any other grid in Workbooks. To refine the results to show only those that are open, click Criteria > Add criteria. From the picklist, choose State.
This will activate the Operator field. Click on the dropdown to see the operators you can apply. To select only open Opportunities select is and in the next box that appears, specify Open. Click Save & Close then click Refresh preview to update the results displayed.
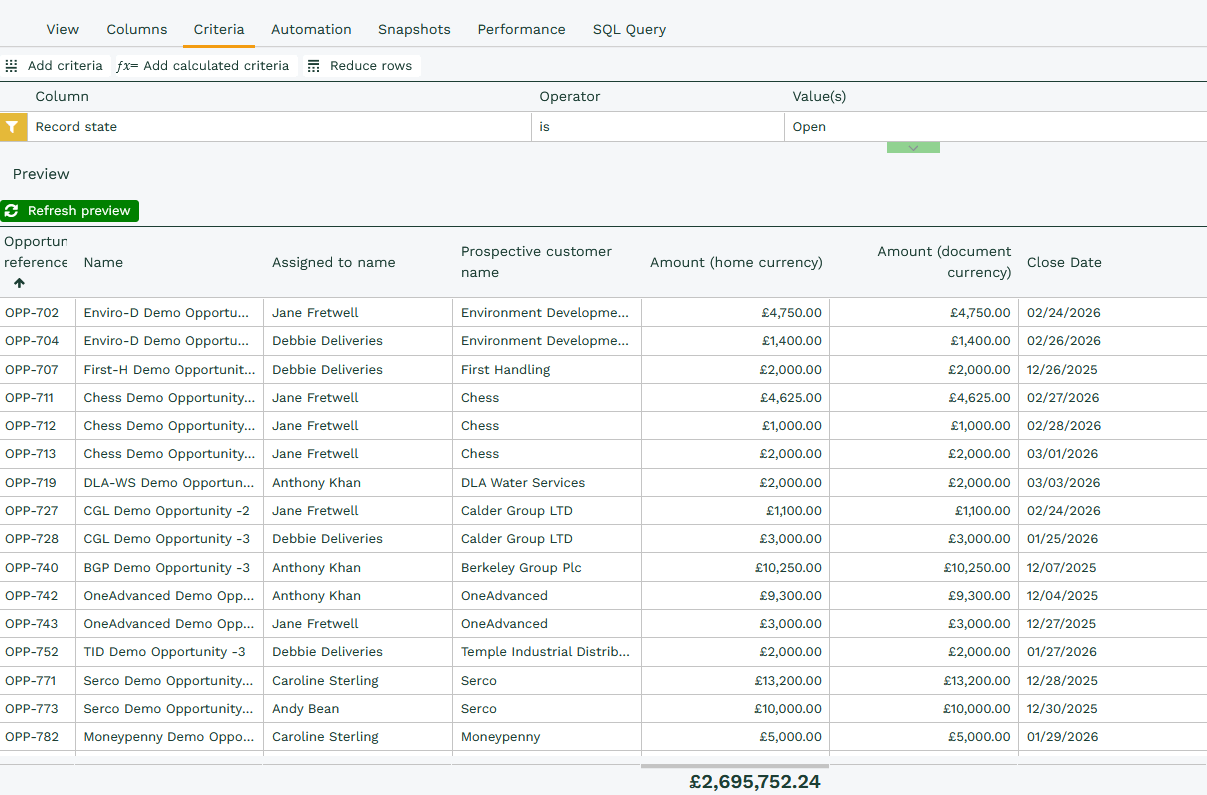
NOTE: This is the Details view, which simply lists opportunities and adds a sub-total at the foot of the Amount column. The Opportunities are not yet Grouped / Summarised. This is done in the next stage, where a Summary View is created.
4. Details View > Automation Tab:
Click here to view information on Automation.
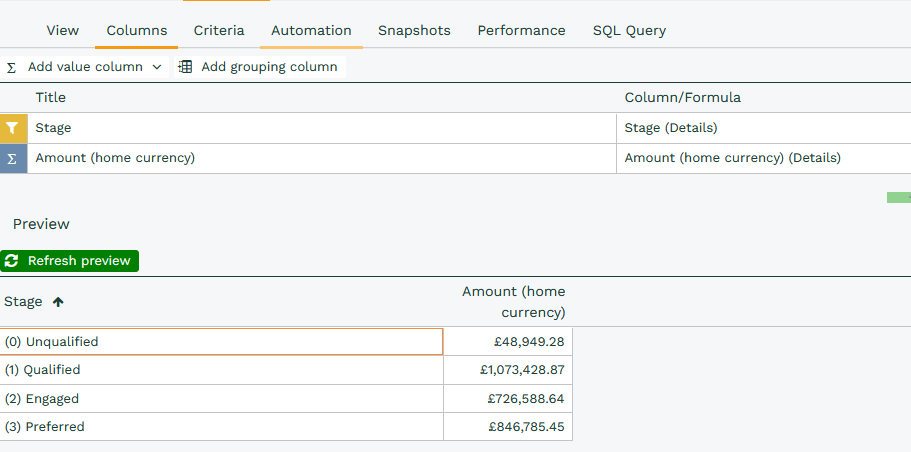
5. Summary View:
Adding a Summary view allows you to Summarise / Group the Opportunities listed in the detail report by a column, in this case Opportunity Stage. Summarising by Opportunity stage will give a breakdown of values for Opportunities at each Stage.
- Click Add Summary View and select Add Summary View from Details.
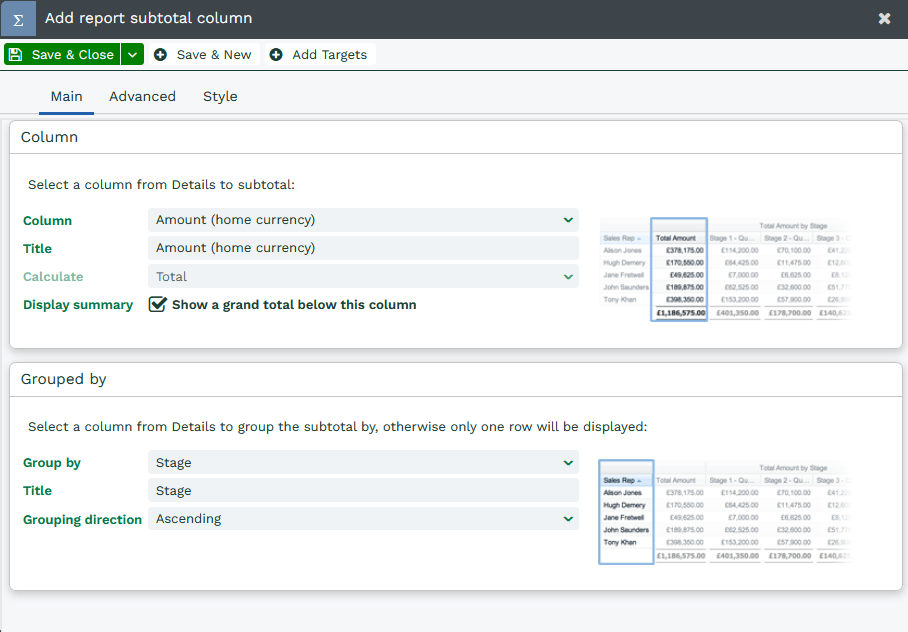
- Click Add value column > Subtotal column.
Next to Column choose Amount. You’ll see that the report defaults to calculating the total and the tick in the checkbox next to Display summary indicates that a grand total will be shown at the bottom of the column.
Next to Group by choose Opportunity Stage. Click Save & Close.
When you refresh your report view you’ll see that you now have a summarised report of open opportunities, grouped by opportunity stage, showing sub-totals for the amount at each stage, as well as the total value for all the open opportunities.
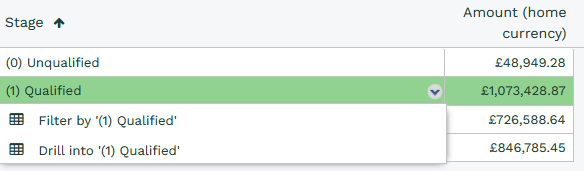
Drilling and Filtering
If you want to see more details about the opportunities that have now been summarised, you can drill into them (which in effect provides you with a filtered list of the opportunities in your details report). Hover over the right-hand side of one of your columns and click on the down arrow. Depending on exactly where you click, you can choose to Filter the results or Drill into the results, as shown below:
NOTE: Drilling and filtering will only work if the checkbox next to Details on the report main tab is ticked.
… and here’s the result. You’ve drilled into the data and the filtered results from the Details tab are displayed.